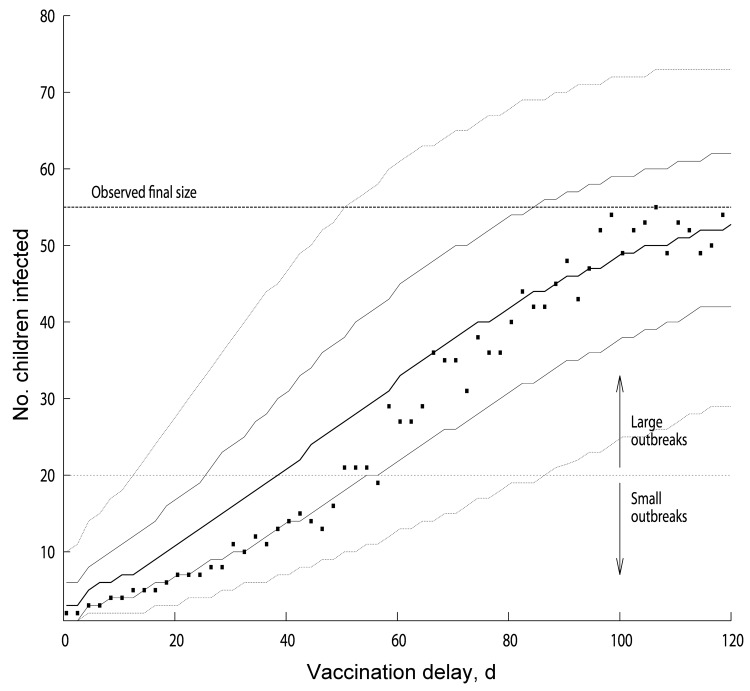
Figure 3.
Distribution of measles outbreak sizes as function of vaccination delay for models with basic reproduction number (R0) of ≈16 and baseline vaccination ratio (BVR) of 91.3% (effective reproduction number ≈1.4). We considered the outbreaks that were still ongoing at the day of implementation of the outbreak-response vaccination campaign and not those that had spontaneously died out earlier by chance. For every given vaccination delay, the squares indicate the most likely large outbreak size, and the thick solid line indicates the median outbreak size value. The thin solid lines indicate 25th and 75th percentiles, and the tiny dotted lines indicate 5th and 95th percentiles of the outbreak size distribution as a function of vaccination delay. The dashed line shows the outbreak size from the observed data, and the dotted line indicates the chosen limit to separate large and small outbreaks.

