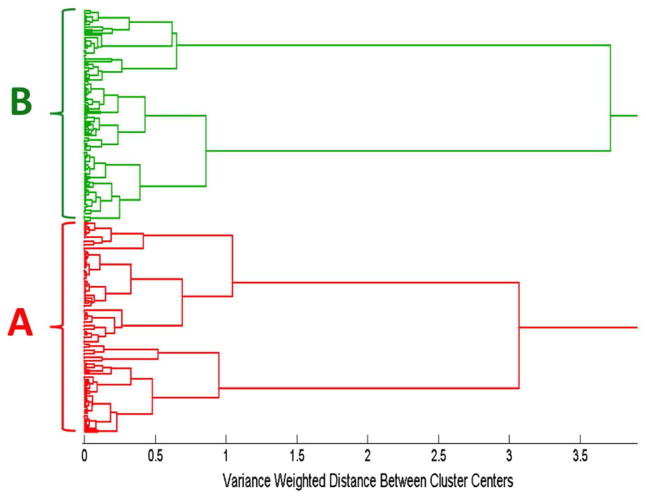
Figure 3.
Dendrogram produced by hierarchical cluster analysis (HCA) of the SERS spectra shown in Fig. 1 using Ward’s method and label-coded as follows: (A) anti-influenza aptamer, blank buffer, and RSV negative control, (B) anti-influenza aptamer incubated with influenza nucleoproteins from A/Uruguay, A/Brisbane, and B/Brisbane. A total of 240 spectra were used to generate this dendrogram, corresponding to 40 spectra in each of the 6 sample categories.

