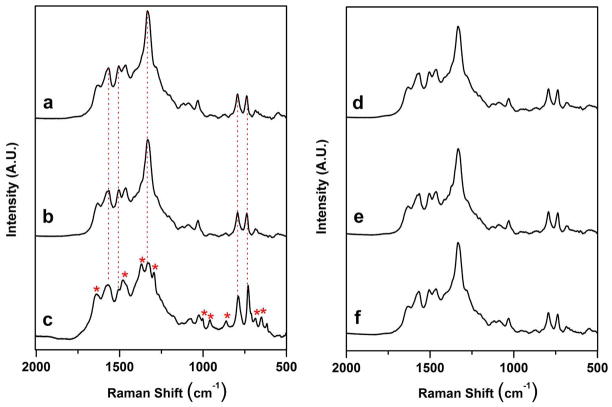
Figure 4.
SERS spectra of the anti-vasopressin aptamer, controls, vasopressin, and influenza nucleoproteins on a Ag nanorod substrate after incubation at 37 °C for 8 hours. (a) anti-vasopressin aptamer (1000 nM) - spacer (100 nM), (b) vasopressin aptamer with blank binding buffer control, (c) vasopressin aptamer with vasopressin (1μg/mL), (d) vasopressin aptamer with nucleoproteins from A/Uruguay, (e) vasopressin aptamer with nucleoproteins from A/Brisbane, and (f) vasopressin aptamer with nucleoproteins from B/Brisbane. Virus concentrations in (d) – (f) are 1μg/mL (relative to HA content). Each spectrum shown is an average of 10 individual spectra for each particular sample. The dashed vertical lines in (a), (b), and (c) indicate the characteristic oligonucleotide bands for the anti-vasporessin aptamer. Asterisks indicate the presence of new bands in the aptamer complex corresponding to binding of the protein target.

