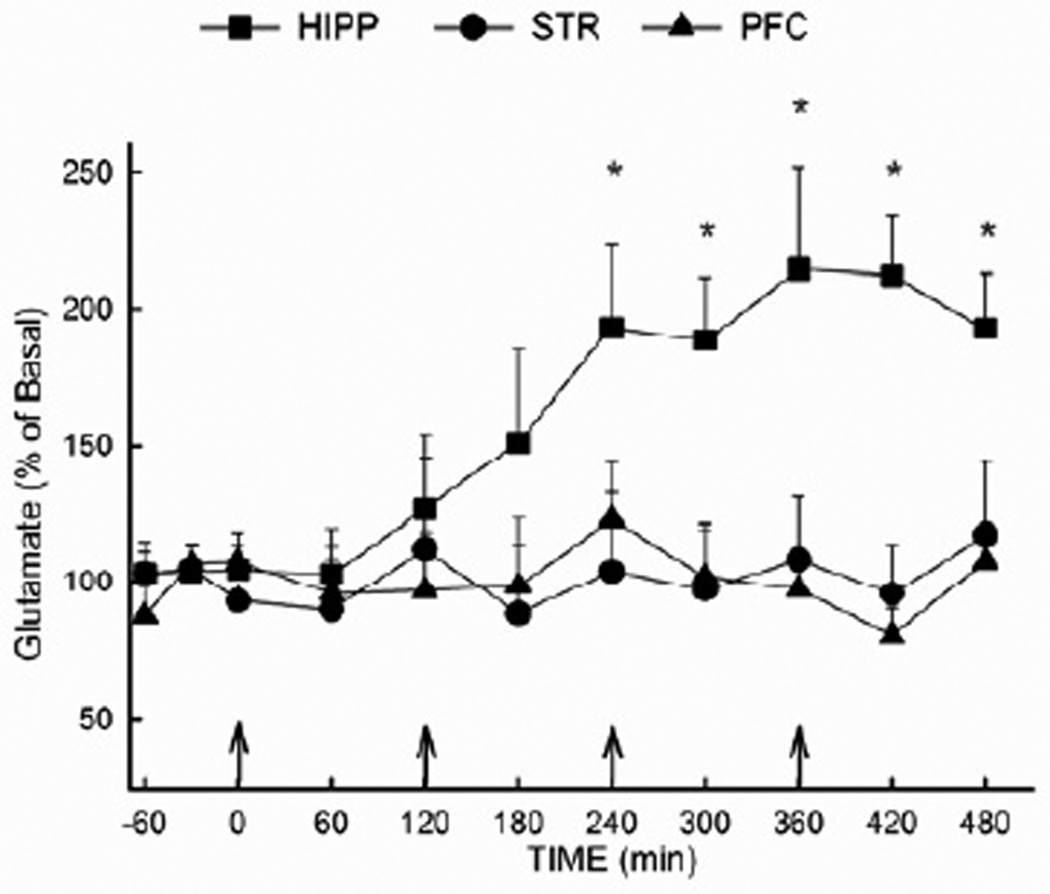
Figure 2. Extracellular glutamate concentrations in the hippocampus, prefrontal cortex and striatum following MDMA administration.
Rats received MDMA (10 mg/kg, i.p.) or vehicle at two hour intervals for a total of four injections (vehicle not shown). Microdialysis was performed in the hippocampus, the prefrontal cortex, or the striatum of separate groups of animals. (n= 4–7 per group) * Indicates values that differ significantly (P<0.05) from the corresponding vehicle-treated animals. The baseline values (mean± SEM) for extracellular glutamate were (in ng/20 µL): 4.52 ± 0.61 for the striatum; 3.37 ± 0.28 for the prefrontal cortex; 2.61 ± 0.56 for the dorsal hippocampus (uncorrected for recovery).

