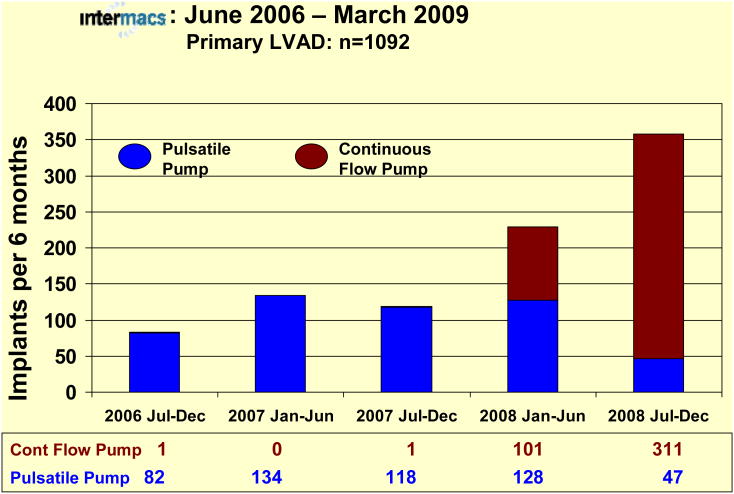
Figure 8.
Bar graph depicting the number of implants for each 6-month interval since the beginning of INTERMACS prospective data collection, divided between pulsatile pumps (Blue) and continuous flow pumps (Red). Note that the initial bar includes some additional patients implanted between June 23 and July 1, 2006, and that the patients implanted between January 1 and March 31, 2009 are not included in this depiction.

