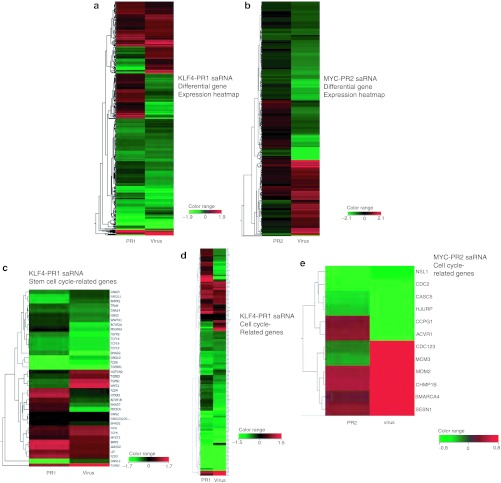
Figure 5.
Differential gene expression of saRNA-transfected and virus-transduced samples compared to control. (a) Expression of all genes with corrected P value <0.05 and absolute fold change >1.5 for KLF4-PR1 and KLF4 virus samples. (b) Expression of all genes with corrected P value <0.1 and absolute fold change >1.5 for MYC-PR2 and c-MYC virus samples. (c) Expression of genes with stem cell-related gene ontology, corrected P value <0.1, and absolute fold change >1.5 for KLF4-PR1 and KLF4 virus samples. (d) Expression of genes with cell cycle-related gene ontology, corrected P value <0.1, and absolute fold change >1.5 for KLF4-PR1 and KLF4 virus samples. (e) Expression of genes with cell cycle-related gene ontology, corrected P value <0.1 and absolute fold change >1.5 for MYC-PR2 and c-MYC virus samples. saRNA, short-activating RNA.

