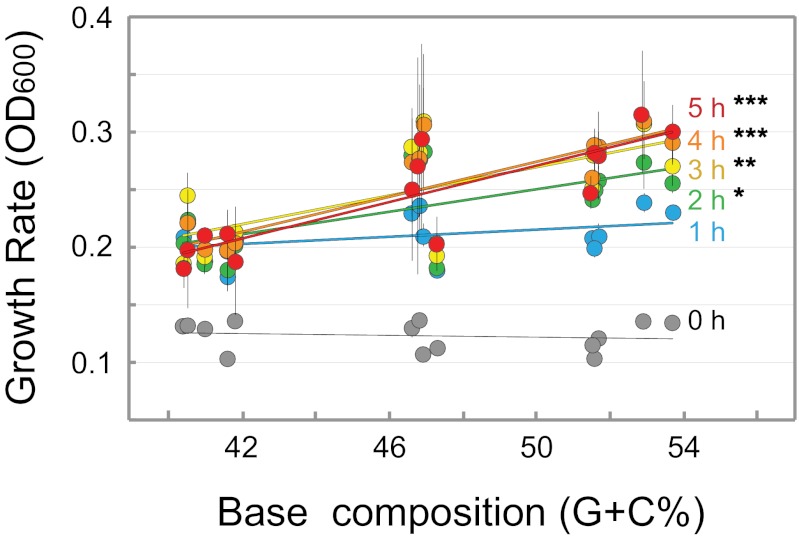
Fig. 1.
Growth rates of isogenic strains expressing GFP genes of different G+C contents. Growth rate (OD600) was measured hourly for 5 h after induction with 1 mM IPTG. A significant association between %G+C and growth rate is observed at 2 h after induction and is evident at all later time points (0 h, r2 = 0.03; 1 h, r2 = 0.15; 2 h, r2 = 0.40; 3 h, r2 = 0.47; 4 h, r2 = 0.67; 5 h, r2 = 0.72). Asterisks denote level of significance: *P < 0.05, **P < 0.01, ***P < 0.001. Values represent the mean ± SD of three replicates. For detailed results of regressions, see Table S1.

