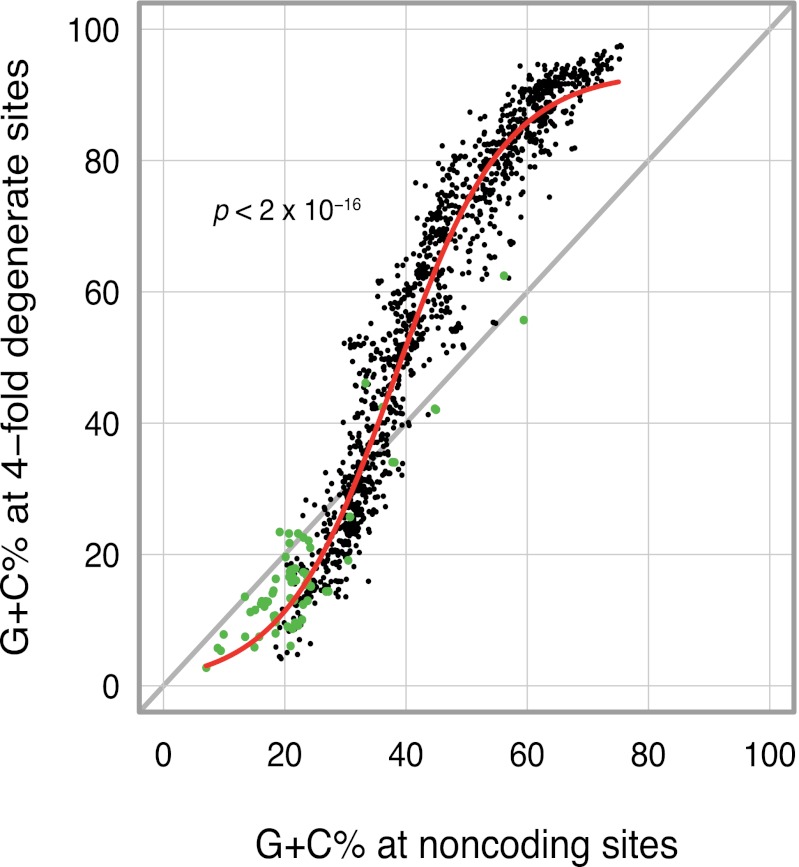
Fig. 5.
Relationship between the average G+C content at fourfold degenerate sites of all protein-coding genes and the average G+C content of noncoding intergenic regions in fully sequenced bacterial genomes (n = 1430). Green circles denote bacteria with genome size of less than one megabase (n = 67), and the red line indicates the logistic regression model fitted to the data.

