Fig. 7.
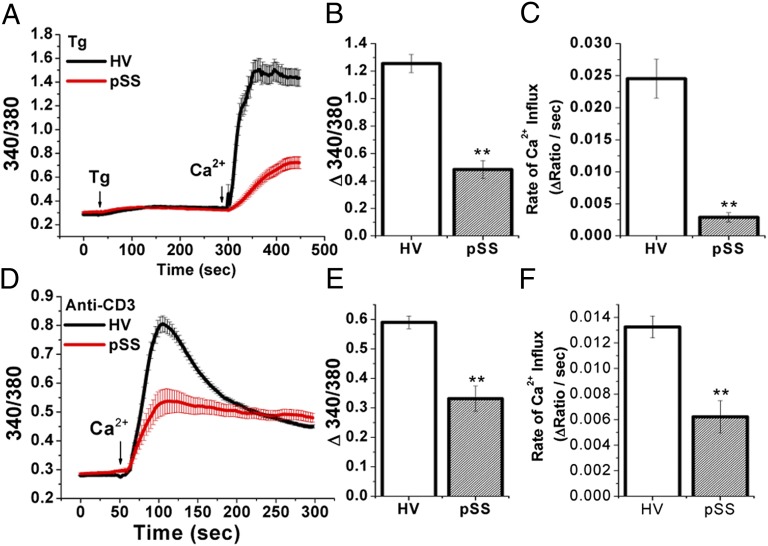
Impaired store-operated Ca2+ entry in pSS PBMCs. Ca2+ entry in PBMCs after stimulation with thapsigargin (A–C) or anti-CD3 antibody (D–F), with cells preincubated with anti-CD3 for 10 min in Ca2+-free medium before the start of the trace. A and D show average Ca2+ influx responses in PBMCs from an HV (black) and a pSS patient (red). B and E show the average Ca2+ influx amplitude (fluorescence increase after Ca2+ addition). In each case, resting fluorescence was subtracted from the peak 340/380 ratio (Tg: HV, 1.26 ± 0.07 vs. pSS, 0.48 ± 0.07; CD3: HV, 0.59 ± 0.02 vs. pSS, 0.33 ± 0.04). C and F show the average rate of Ca2+ influx, the rate of fluorescence increase after Ca2+ addition (Tg: HV, 0.0245 ± 0.003 vs. pSS, 0.0029 ± 0.001; CD3: HV, 0.0132 ± 0.001 vs. pSS, 0.006 ± 0.001). Error bars represent SEM. **Values significantly different (P < 0.01) from the respective control value. Data represent results from at least 50–150 cells for each group.

