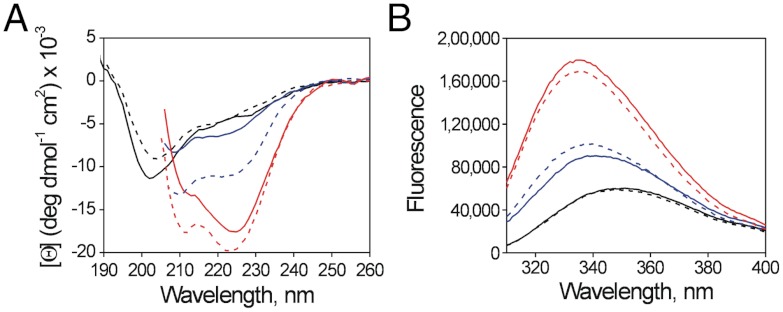
Fig. 1.
Helical structure and tryptophan fluorescence responses to the membrane environment of WT and P20G pHLIP. (A) Circular dichroism experiments of WT (continuous lines) and P20G (dotted lines) in buffer at pH 7.8 (state I; black lines) and 18∶1-PC liposomes, at pH 7.8 (state II; blue lines) and pH 4.5 (state III; red lines). (B) Emission fluorescence spectra, with lines as in panel A.

