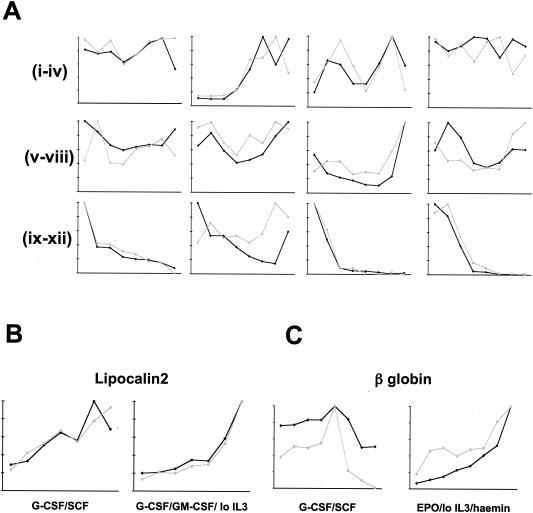
FIG. 3.
Comparison of gene expression assayed by microarray and by RQ-PCR. For each series and for each gene analyzed, the values of both parameters at each time point were normalized relative to that with the highest value, which was arbitrarily assigned as 10. Microarray signal intensity is plotted in black, and RQ-PCR fluorescence in gray. (A) Analysis of arbitrarily selected genes during neutrophil differentiation of FDCP-mix cells supported by G-CSF plus SCF. Subpanels (from left to right): i, CD14; ii, MPO; iii, c-kit; vi, IL-3 receptor α chain; v, HPRT; vi, GAPDH; vii, schlafen 2; viii, β-catenin; ix, NDPP1; x, selenium-binding protein; xi, nephroblastoma overexpressed; xii, AEG-1 (acidic epididymal glycoprotein 1). (B) Analysis of lipocalin 2 (neutrophil marker) during neutrophil differentiation of FDCP-mix cells supported by G-CSF plus SCF (i) and during myelomonocytic differentiation of FDCP-mix cells supported by G-CSF plus GM-CSF plus low IL-3 (ii). (C) Analysis of β globin (erythroid marker) during neutrophil differentiation of FDCP-mix cells supported by G-CSF plus SCF (i) and during erythroid differentiation of FDCP-mix cells supported by EPO plus low IL-3 plus hemin (ii) as indicated.

