FIG.5.
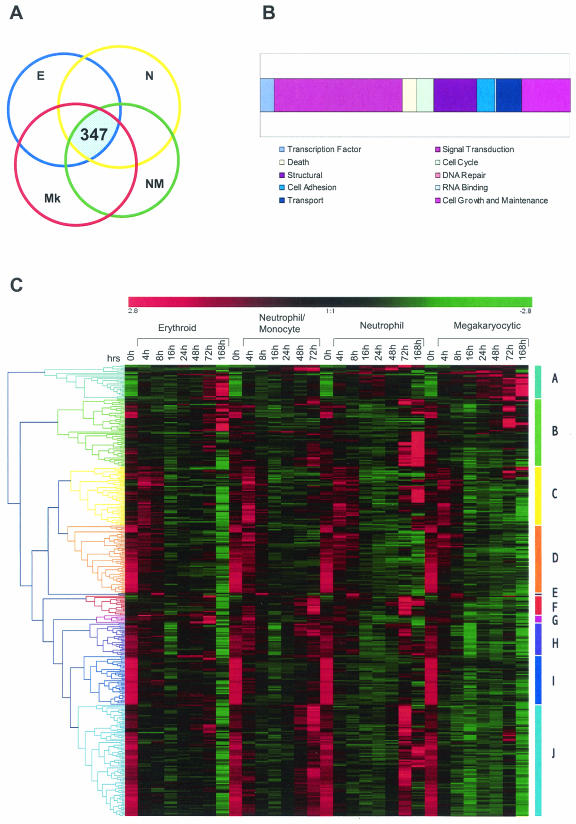
Analysis of genes that are differentially expressed under all differentiation conditions. Gene expression levels for the four differentiation pathways analyzed (E, erythroid; N, neutrophil; NM, neutrophil/monocyte; Mk, megakaryocyte) were separately filtered by SAM as shown in Table 1. (A) The intersection of these four lists identifies 347 genes that are differentially expressed under all of the conditions tested. (B) Simplified ontologies were generated as in Fig. 4. (C) Hierarchical clustering of the 347 genes was performed as indicated in the legend for Fig. 4. Note that although all genes are differentially expressed in all four pathways they do not necessarily show similar expression profiles. For example, most of the genes in cluster D are similarly downregulated during differentiation in all pathways. However, genes belonging to cluster J show initial downregulation for all pathways and are upregulated only in neutrophil/monocyte and neutrophilic pathways at later time points.

