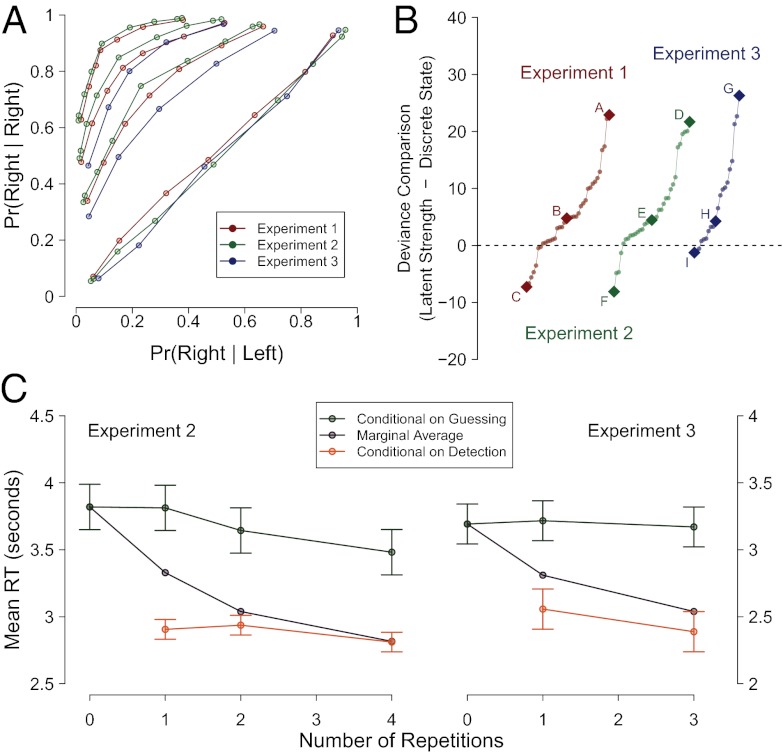
Fig. 3.
(A) Average ROC plots from each repetition condition across each experiment. The curvature and symmetry about the negative diagonal is typical for a 2AFC recognition memory task. (B) Deviance difference values for all subjects. Positive values indicate lower penalized deviance (better fit) for the discrete-state model than the latent-strength model. The plot shows that for a majority of the subjects, the comparison favors the discrete-state model. (C) Mean response time as a function of repetition for experiments 2 and 3. Observed marginal RTs, RTs conditional on detection, and RTs conditional on guessing are shown in purple, orange, and green, respectively. Error bars denote 95% within-subject confidence intervals.

