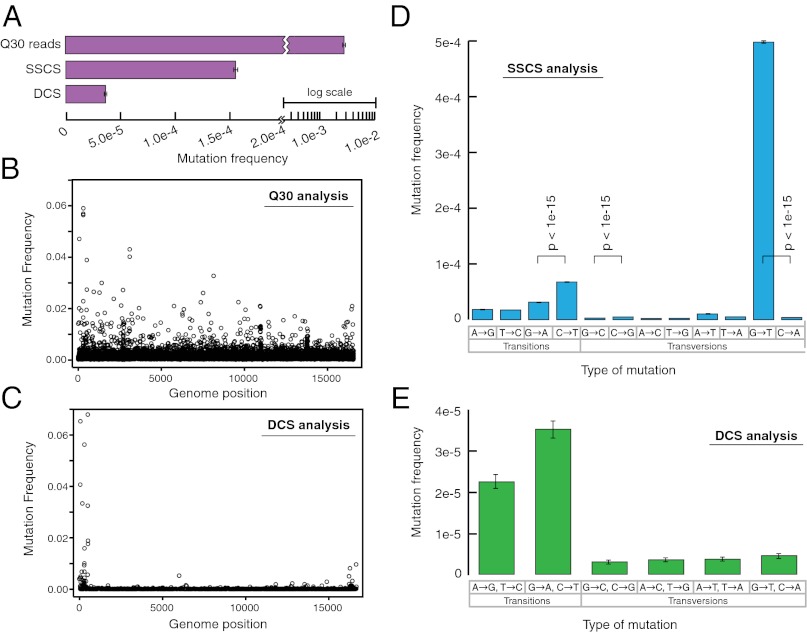
Fig. 4.
Duplex Sequencing of human mitochondrial DNA. (A) Overall mutation frequency as measured by a standard sequencing approach, SSCS, and DCS. (B) Pattern of mutation in human mitochondrial DNA by a standard sequencing approach. The mutation frequency (vertical axis) is plotted for every position in the ∼16-kb mitochondrial genome. Due to the substantial background of technical error, no obvious mutational pattern is discernible by this method. (C) DCS analysis eliminates sequencing artifacts and reveals the true distribution of mitochondrial mutations to include a striking excess adjacent to the mtDNA origin of replication. (D) SSCS analysis yields a large excess of G→T mutations relative to complementary C→A mutations, consistent with artifacts from damaged-induced 8-oxo-G lesions during PCR. All significant (P < 0.05) differences between paired reciprocal mutation frequencies are noted. (E) DCS analysis removes the SSCS strand bias and reveals the true mtDNA mutational spectrum to be characterized by an excess of transitions.

