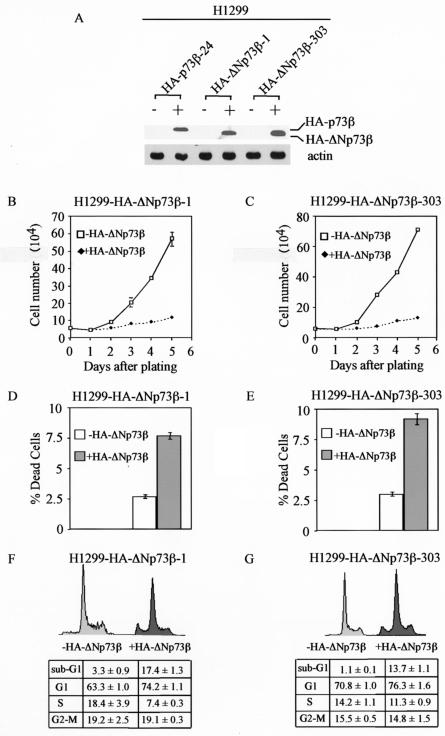
FIG. 1.
HA-ΔNp73β induces cell cycle arrest and apoptosis in H1299 cells. (A) Levels of induced expression of HA-p73β and HA-ΔNp73β in H1299 stable cell lines are comparable. Western blot analysis was performed by using cell extracts from uninduced cells (−) and cells that were induced (+) to express HA-p73β or HA-ΔNp73β for 24 h. HA-p73β and HA-ΔNp73β were detected with anti-HA polyclonal antibodies (Y-11). Actin was detected with antiactin polyclonal antibodies and was used as an equal loading control. (B and C) HA-ΔNp73β suppresses cell growth in H1299 cells. Approximately 6 × 10⁴ HA-ΔNp73β-1 cells (B) and HA-ΔNp73β-303 cells (C) were seeded in 60-mm-diameter plates in the presence or absence of tetracycline (2 μg/ml) to regulate the expression of HA-ΔNp73β. At time points indicated, live cells on the plates were trypsinized and were collected separately. Cells from each plate were counted four times by using the Coulter cell counter. The average number of cells from two plates was used for growth rate determination. (D and E) HA-ΔNp73β induces cell death in H1299 cells. H1299 cells were seeded at approximately 6 × 10⁴ in 60-mm-diameter plates in the presence or absence of tetracycline (2 μg/ml) for 3 days. At 72 h after plating, both floating cells in the media and live cells on the plates were collected and stained with trypan blue dye for 15 min. Both live (unstained) and dead (stained) cells were counted two times in a hemocytometer. The percentage of dead cells was calculated by using the number of dead cells dividedby the total cells counted. (F and G) HA-ΔNp73β induces cell cycle arrest and apoptosis in H1299 cells. H1299 cells were seeded at 2 × 10⁵ per 90-mm-diameter plate in the presence or absence of tetracycline (2 μg/ml). At 72 h after plating, both floating and dead cells in the media and live cells on the plates were collected and were fixed with 1 ml of 100% ethanol overnight and were then centrifuged and resuspended in 300 μl of PBS solution containing 50 μg each of RNase A and propidium iodide per ml. The stained cells were measured by fluorescence-activated cell sorter analysis. The percentage of cells in the sub-G1, G0, and G1, S, and G2 to M phases was determined by using the Cell Quest program. The percentage of cells in the G0 and G1, S, and G2 to M phases was recalculated after subtracting the number of cells in the sub-G1 phase from the total population. The percentage of cells in the sub-G1 phase was used as an index for the degree of apoptosis.

