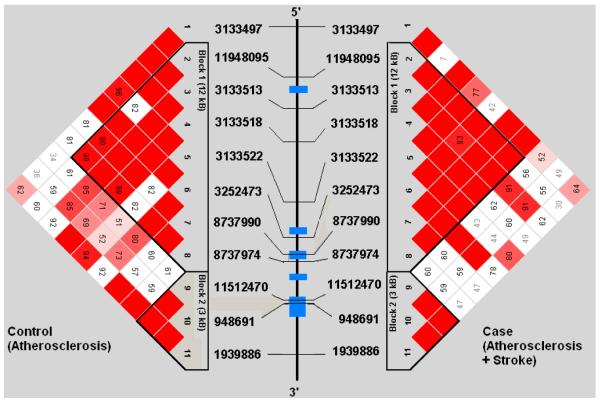
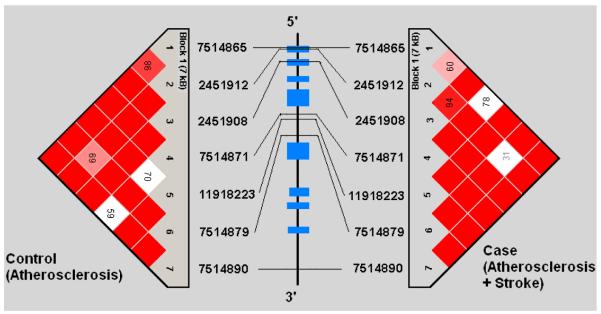
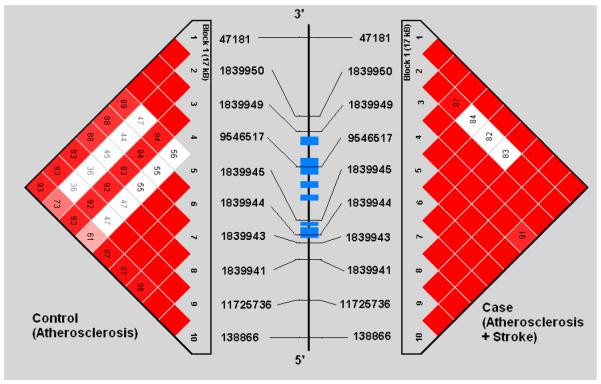
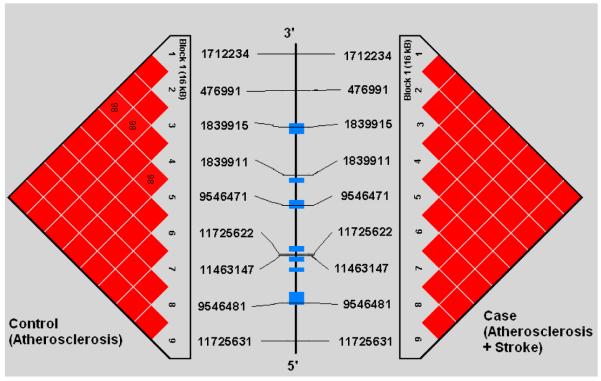
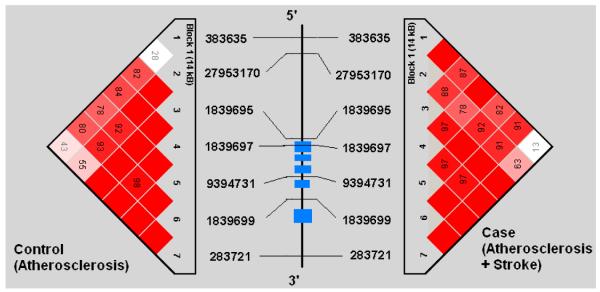
Figures 1a-1e.
represent a schematic of the study genes with an LD Matrix for subjects with symptomatic carotid atherosclerosis (Case) compared to subjects with asymptomatic carotid atherosclerosis. Horizontal cross lines indicate the approximate positions of each SNP. The blue boxes represent exons. Each box in the matrices represent D’, % linkage disequilibrium (LD) between SNP pairs, as generated by Haploview. Boxes without numbers represent complete LD, D’ = 1. SNP ID numbers are from the public database rs numbers.

