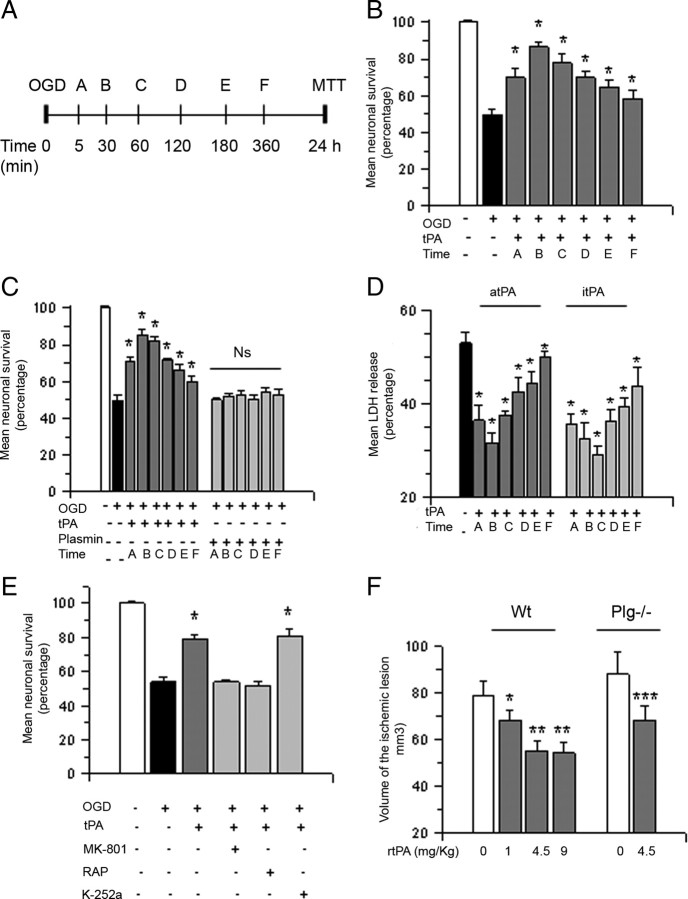
Figure 2.
Treatment with tPA promotes cell survival in cerebral cortical neurons exposed to hypoxic conditions and in the ischemic brain following tMCAO. A, Experimental design used to study the effect of tPA on neuronal survival. Letters denote time of treatment with tPA after exposure to oxygen–glucose deprivation conditions. B–D, Mean cell survival (B, C) and release of LDH into the culture media (D) in Wt cerebral cortical neurons treated with 5 nm proteolytically active (B, D) or inactive tPA (C, D) or 10 nm plasmin (C) 5, 30, 60, 120, 180, or 360 min after exposure to 55 min of OGD conditions; n = 20 in B and 15 in C and D. B, *p < 0.05 compared to neurons exposed to OGD conditions without subsequent treatment with tPA. C, *p < 0.05 compared to neurons left untreated after exposure to OGD conditions; Ns, Nonsignificant. D, *p < 0.05 compared to cells exposed to OGD conditions without subsequent treatment. Lines denote SD. E, Mean cell survival in Wt cerebral cortical neurons exposed to 55 min of OGD conditions and treated 1 h later with 5 nm tPA alone or in combination with 10 μm MK-801, 60 nm RAP, or 100 nm TrkB inhibitor K-252a; n = 10. *p < 0.05 compared to neurons treated with tPA alone or with a combination of tPA and K-252a. Lines denote SD. F, Mean volume of the ischemic lesion in Wt and Plg−/− mice treated 1 h after tMCAO with saline solution (white bars) or rtPA 1 – 9 mg/Kg/IV (gray bars); n = 10 per group. *p < 0.05 compared to Wt mice treated with saline solution; **p < 0.05 compared to mice treated with 1 mg/kg/i.v. of rtPA. ***p < 0.05 compared to Plg−/− mice treated with saline solution. Bars depict mean volume of the ischemic lesion in mm3. Lines denote SD.

