
Figure 5. Changes in the TCA cycle during the LCMV immune response.
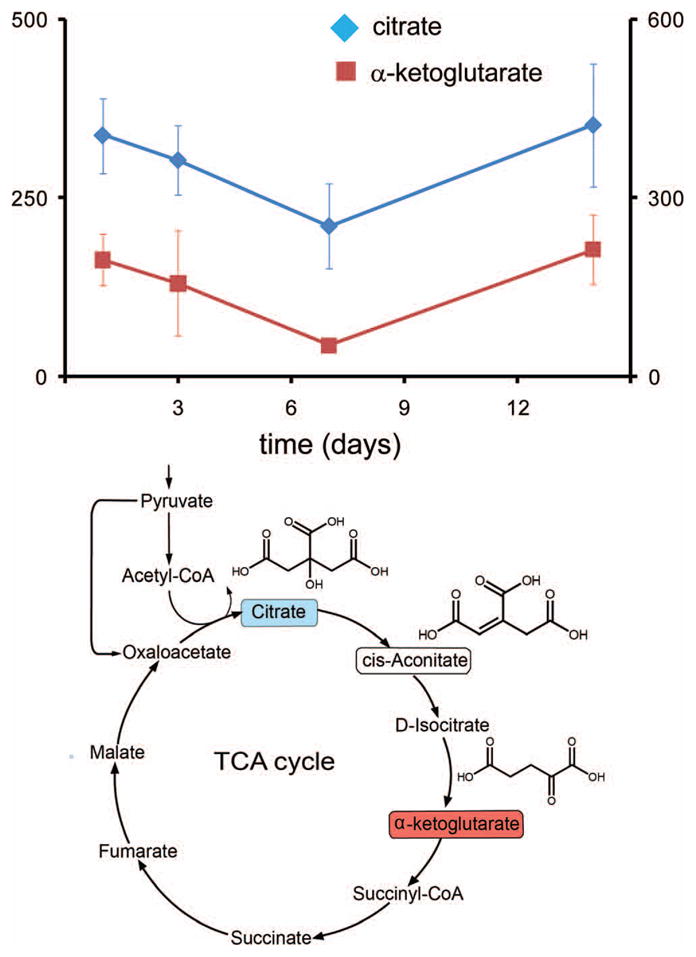
Three metabolites from the TCA cycle (below) were found to change significantly in concentration, and in a concerted fashion, following a response and recovery pattern. (above) Concentrations of citrate (red), α-ketoglutarate (blue) and cis-aconitate (Table II, not shown in figure) decrease at day 3, reaching a minimum concentration at day 7, and return to the initial concentration at day 14. Vertical axes are in relative units of integrated intensity (left, x10,000; right, x1,000). (below) TCA cycle, showing altered compounds (color coding as in graph).