
Figure 2.
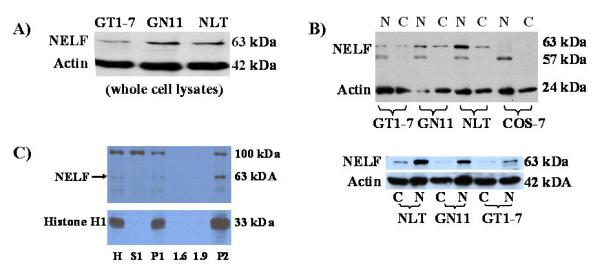
A) Protein expression by western blot analysis with our new anti-NELF antibody is greater in migratory NLT and GN11 cells than postmigratory GT1-7 cells. B) Following cellular fractionation, NELF expression is greater in the nucleus than the cytoplasm in all three GnRH cell lines as represented by a ~63 kDa band. A smaller ~57kDa nonspecific band was seen in the nuclear fraction, which could represent a NELF splice variant. Note absence of the 63 kDa band in COS-7 cells. The lower figure clearly shows greater nuclear expression in all three GnRH cell lines. Beta-actin was used as a loading control. C) Following sucrose density gradient separation, NELF expression was seen in the nucleus. The most intense expression of NELF was seen in the final nuclear pellet P2. Abbreviations are as follows: H = histone; S1 = supernatant 1; P = pellet 1; 1.6 M and 1.9 M sucrose layers; P2 = pellet 2, which comprises the nuclear pellet. A 100 kDa nonspecific band is seen in some fractions.