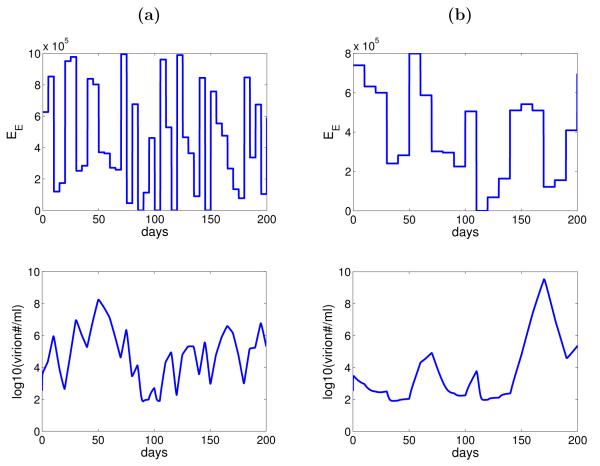
Figure 7.
Numerical simulation of the model (Equation 3.1) with random variation in the number of epithelial cells susceptible to epithelial-cell virus. (a) The value of EE is redrawn every 5 days. (b) The value of EE is redrawn every 10 days. Other parameters are listed in Table 1 and 3 (subject 1).

