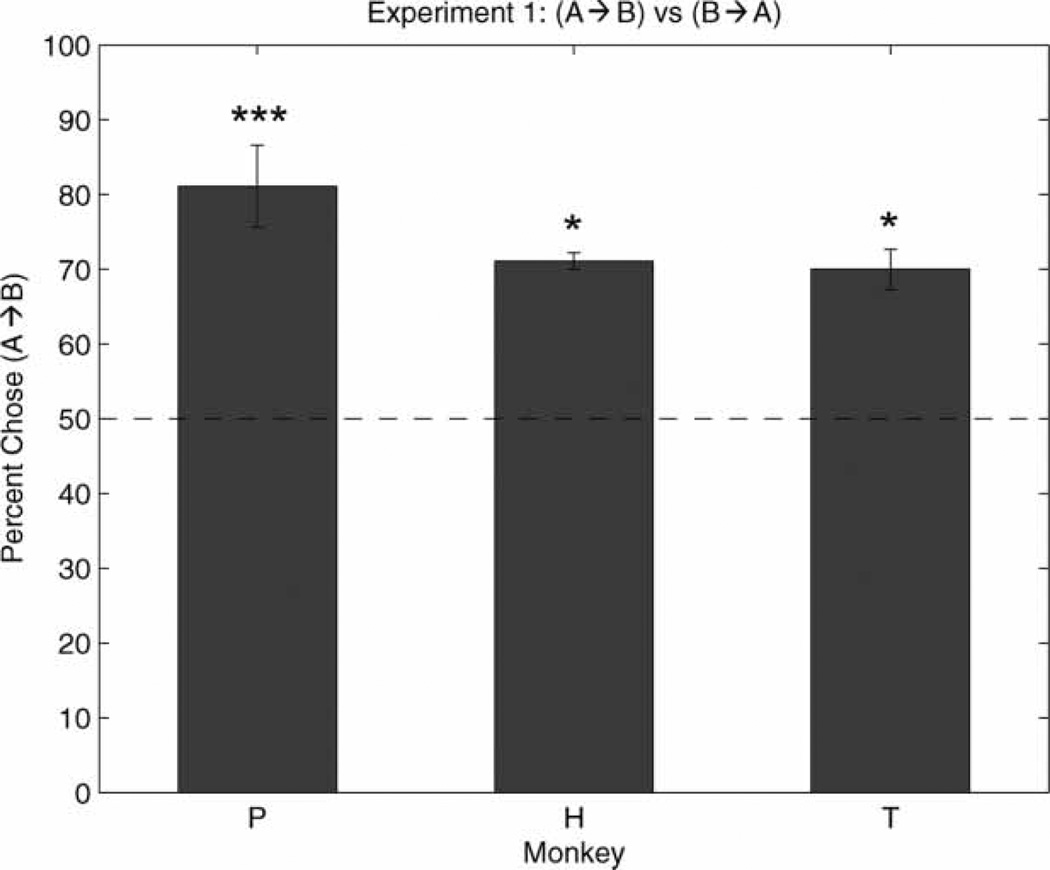
Figure 1.
Experiment 1 results, with one choice giving a grape followed 4 s later by a half vegetable (A → B), and the other giving a half vegetable followed 4 s later by a grape (B → A). The y axis plots the mean percentage of trials that each monkey selected (A → B) from the first significant session to the third significant session. Error bars are standard errors of measurement, the dashed line at 50% is random performance, and asterisks represent each monkey’s chi-squared (χ2) p-value across the sessions: *p < .05, **p < .01, ***p < .001.

