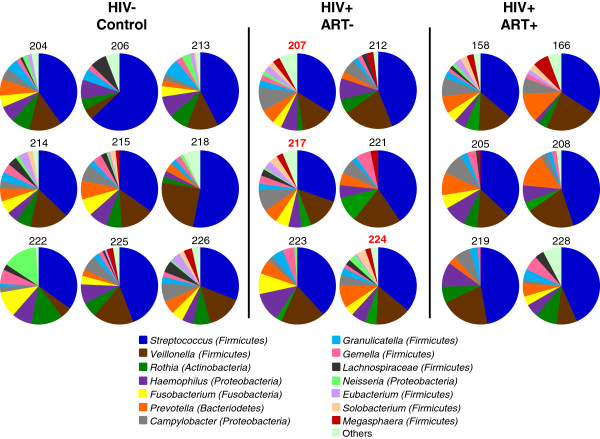
Figure 4.
Proportions of taxonomic assignments at the genus level in individual control subjects and HIV + patients. The relative proportions of the genera detected in the total lingual bacterial community of each study participant are represented in pie charts. Similar genus distribution profiles were identified in 3 untreated HIV infected patients (207, 217, and 224: labelled in red text).

