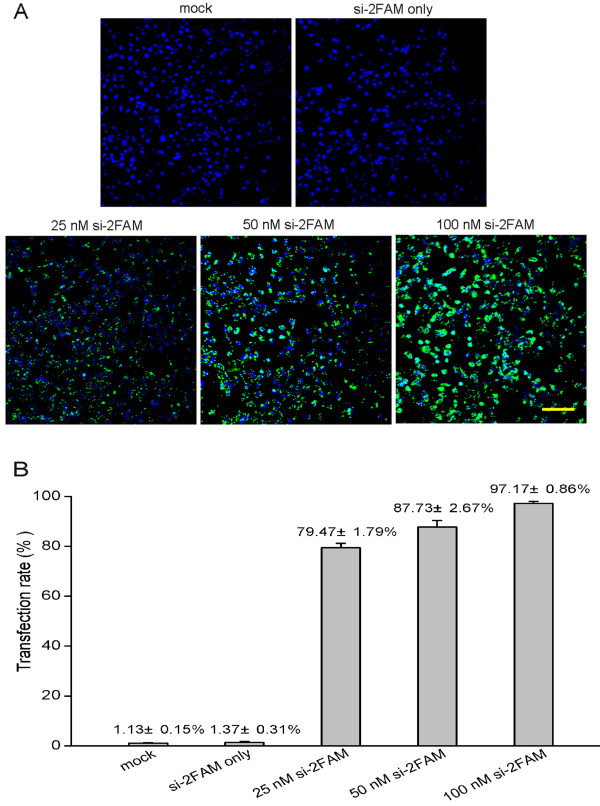
Figure 1.
RD cells transfected with increasing concentrations of fluorescein labeled si-2FAM. (A) Representative confocal microscopy images of RD cells transfected with 25, 50, or 100 nM of si-2FAM are shown, as indicated. Cell nuclei were stained with Hoechst 33258 dye. The image marked ‘si-2FAM only’ indicates RD cells treated with 100 nM si-2FAM without LipofectamineTM 2000. The mock transfection control was carried out without the addition of si-2FAM. Bar = 100 μm. (B) Transfection efficiency of different concentration of si-2FAM. The proportions of fluorescein-labeled RD cells transfected with 25, 50, or 100 nM si-2FAM at 6 h post-transfection were shown using FACSAria flow cytometry. All data are presented as means ± SD from three independent experiments.

