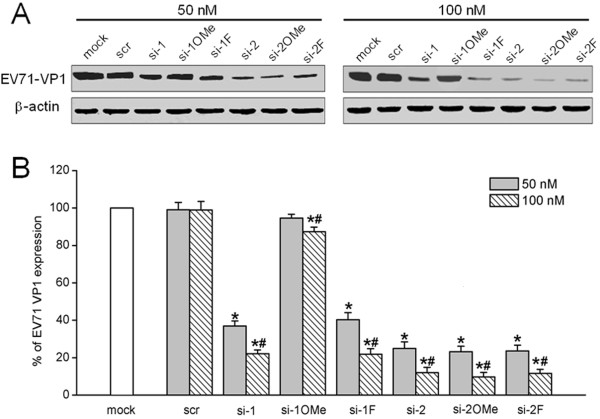
Figure 5.
Western blot analysis of EV71 VP1. RD cells were transfected with unmodified and 2′-modified siRNAs targeting the 5′ UTR of the EV71 genome and then infected with 0.01 MOI of EV71. At 36 h post-infection, total proteins were extracted from the RD cells. (A) Representative western blot of VP1 proteins detected using an anti-EV71 VP1 mouse polyclonal antibody. The internal loading control was detected using an anti-β-actin antibody. (B) Quantification of western blot bands was performed using Image J software. The VP1 protein level from the mock transfection control cells was set as 100%. Data were normalized by the β-actin level. All data are presented as means ± SD from three independent experiments. *P < 0.05, compared with mock transfection control. #P < 0.05, compared with 50 nM of si-1, si-1OMe, si-1 F, si-2, si-2OMe, and si-2 F, respectively.

