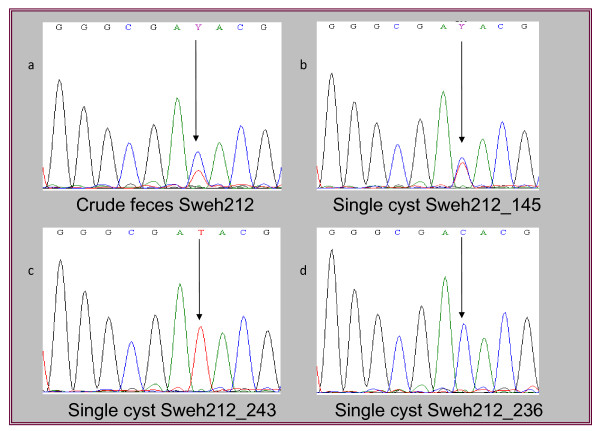
Figure 1.
Sequence chromatograms of nucleotide variations. Chromatogram of a sequence generated from crude DNA from patient Sweh212, where the position indicated with an arrow shows the presence of a double peak (a). Sequencing of single cysts from the same patient indicates the presence of a double peak or ASH at the single cell level (b), and importantly, single cyst analyses also show that there are sub-populations present where double peaks do not exist in the same position (c and d).

