Figure 2 .
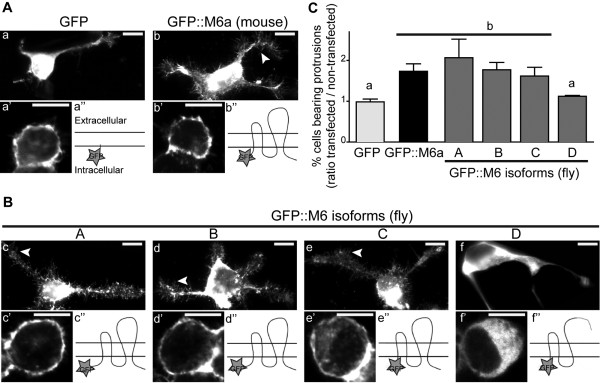
M6 isoforms are functionally conserved inDrosophila. Twenty-four hours after transfection N2a cells were fixed and stained with phalloidin to visualize F-actin and assess filopodium formation. (A-B) Fluorescent images of transfected N2a overexpressing GFP (a), GFP::M6a (b) and the fruit fly GFP::M6 isoforms (c-f). Arrowheads indicate filopodial protrusions. Confocal images showing the subcellular localization of GFP (a’), GFP::M6a (b’) and the GFP::M6-A, -B and -C isoforms (c’, d’, e’) at the cell surface. In contrast, the M6-D isoform (f’) mostly localized to the intracellular compartment. Scale bar is 10 μm. A schematic representation of the protein conformation (a”, b”, c”, d”, e”, f”) is also included. (C) M6 overexpression induced filopodium formation in N2a cells. The ratio of transfected to non-transfected filopodium-bearing cells from the same coverslip were determined. A ratio value similar to one implies that filopodium formation was not induced. Mean ± SEM; N = 3. Statistical analysis included a reciprocal data transformation (multiplicative inverse) and a Randomized Block ANOVA (p < 0.05) followed by a BBS multiple comparison. Different letters indicate significant differences.

