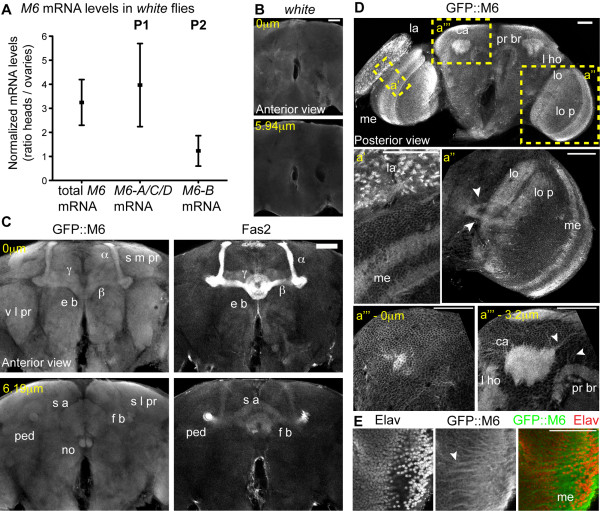
Figure 3 .
M6 localizes to neuropils and projections in the adult brain. (A) M6 levels measured in control (w) ovaries and heads by RT-qPCR. Total M6 mRNA was quantified using primers directed to the 3’UTR of all M6 isoforms. Levels of M6-A/C/D, derived from promoter 1 (P1, left panel) and M6-B, from P2 (right panel), were quantified using primers annealing at the 5’UTR of the P1- or the P2-transcripts (exon Ia and Ib, respectively; black arrows in Figure1A). The ratios between normalized M6 expressions in heads relative to ovaries are plotted. Ratio of mean ± SEM, n = 3. (B-E) M6 localization was analyzed using a GFP protein trap (M6GFP) that expresses endogenous levels of GFP-tagged M6 isoforms [20]. Brain immunofluorescence of control white (B) or M6GFP (CE) adults stained with GFP, FasII (neuropil marker, C) and Elav (neuronal marker, E). Magnified views of the regions indicated in D are in a’a” and a”’. Single confocal sections of brain frontal views are shown (anterior view in C (0 μm); posterior view in D). Two depths of a Z-stack from the same brain are presented in B (0 μm and 5,94 μm), in C (0 and 6.19 μm), and in D a”’ (0 and 3.2 μm). The neuropils labeled in M6GFP included: lamina (la), outer and inner medulla (me), lobula (lo) and lobula plate (lo p), calyx neuropil (ca), pedunculus (ped), Kenyon cells (α, β and γ), ellipsoid body (e b), superior arch (s a), fan shaped body (f s), noduli (no), protocerebral bridge (pr br), lateral horn (l ho), superior medial protrocerebrum (s m pr), ventrolateral protocerebrum (v l pr) and superior lateral protocerebrum (s l pr). Cortical neuronal cell body layer at the surface of the brain is shown (D a”’-0 μm). (E) Magnified views of the medulla. White arrowheads point to projections (ED a”, a”’ (3.2 μm)). Scale bar, 50 μm.

