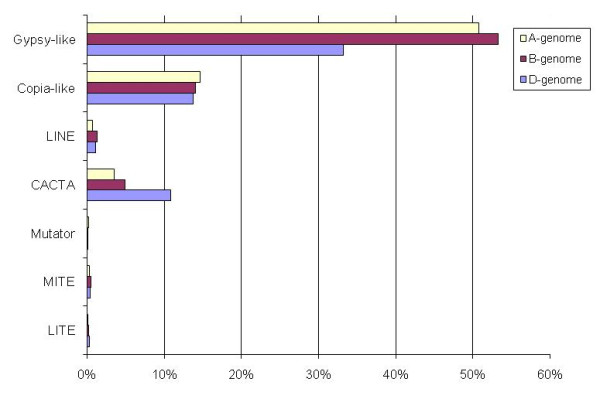
Figure 2.

Histogram showing the comparative abundance of different retrotransposons and DNA transposon families (data expressed in per cent of genome) in the three homoeologous genomes of wheat. The BAC end sequences for chromosome arm 3AS (A genome) and comparison with the B and D genomes. The data representative for the B and D genomes was obtained in a similar way, using 10.8 Mb of BESs from wheat chromosome 3B [9], and the D genome was represented by 2.9 Mb sequence obtained from whole-genome, shotgun sequence form Ae. tauschii the D-genome donor of bread wheat [38].
