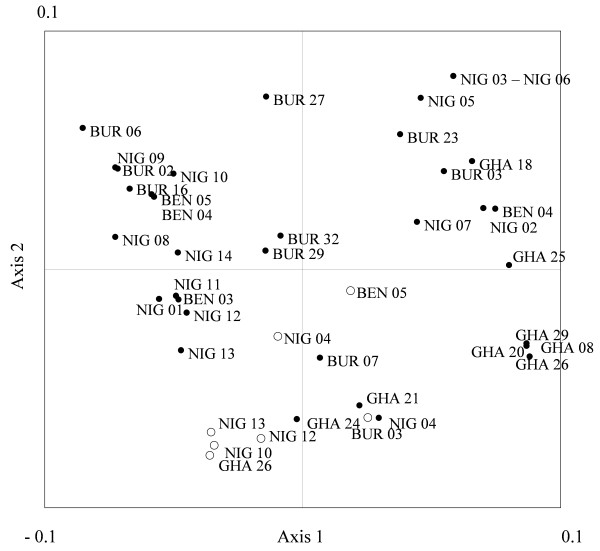
Figure 3.
Principal coordinate analysis. PCO (Principal coordinate) map (Axes 1 and 2) of the sampled populations based on their genetic distances. White dots correspond to domesticated populations; black dots, wild populations. The two first axes accounted for 73.6% of the total variation (43.2% and 30.4% for axis 1 and axis 2, respectively).

