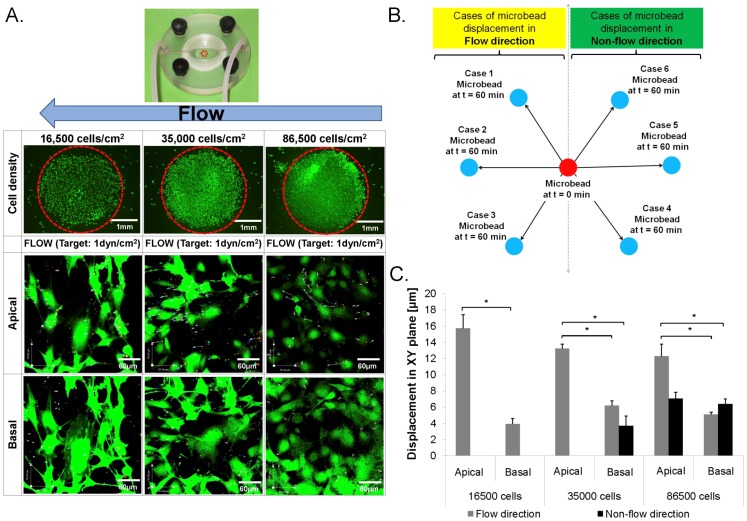
Figure 2. In situ mapping of stem cell stresses and strains.
4D (x,y,z,t) image of microsphere displacements (A, C, E) and microbead displacements (B, D, F) shows flow fields and surface strains, respectively, in live stem cells subjected to fluid flow at low (A,B), high (C,D), and very high (E,F) densities. Calcein Green stains live cells. Red and white arrows indicate velocity of flow (microsphere displacement and direction: A, C, E) and strain (microbead displacements: B, D, F), respectively. Red, green, and white dots (B, D, F) show respective microbead positions at 0, 30, and 60 minutes after flow. Stresses imparted by flow at cell surfaces are calculated from the experimentally determined velocity gradient (slope of Fig. S1, Equation 3). Cell surface strains (deformations) are calculated using experimentally measured microbead displacements on cell surfaces.

