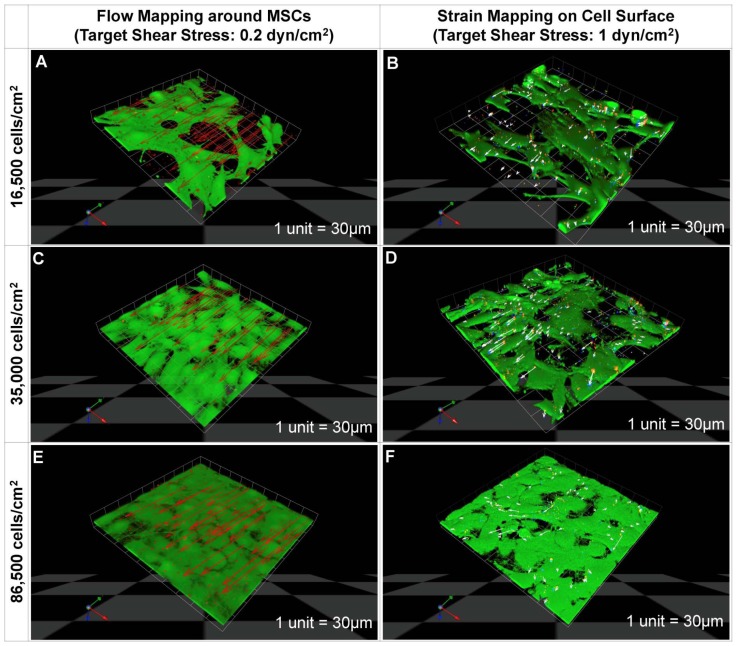
Figure 3. Computational predictions (CFD-FEM) of strains on cell surfaces for flow rates imparting 0.2 (A,B) and 1 dyn/cm2 (C,D).
Each computational prediction includes velocity magnitude and displacement in XY plane, assuming an elastic modulus of 0.9 Pa (A and C), and in the Z direction, assuming an elastic modulus of 90 Pa (B and D) at 16,500 cells/cm2 (1); computational predictions were carried out for 35,000 cells/cm2 (2), and 86,500 cells/cm2 (3) cell seeding densities. Topological color map indicates displacements on surface of seeded cells. The geometry of the seeded cells is imported from a 3D reconstruction of confocal images. Color arrows show flow velocity (flow field) in the near the vicinity of cells.

