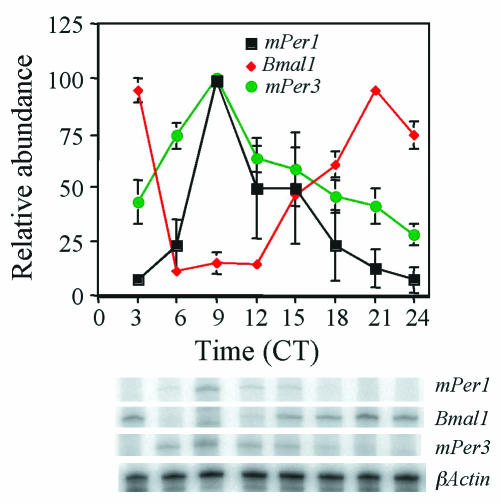
FIG. 4.
Circadian oscillation of mPer3 mRNA. mPer1, mPer3, and Bmal1 RNA rhythms in liver were determined by RNase protection assay at 3-h intervals on the first day in constant darkness (DD). Each value was normalized to β-actin and converted to the percentage of maximal value for each gene. Mean values and standard errors from three separate experiments are shown. A representative autoradiogram is shown at the bottom of the figure.

