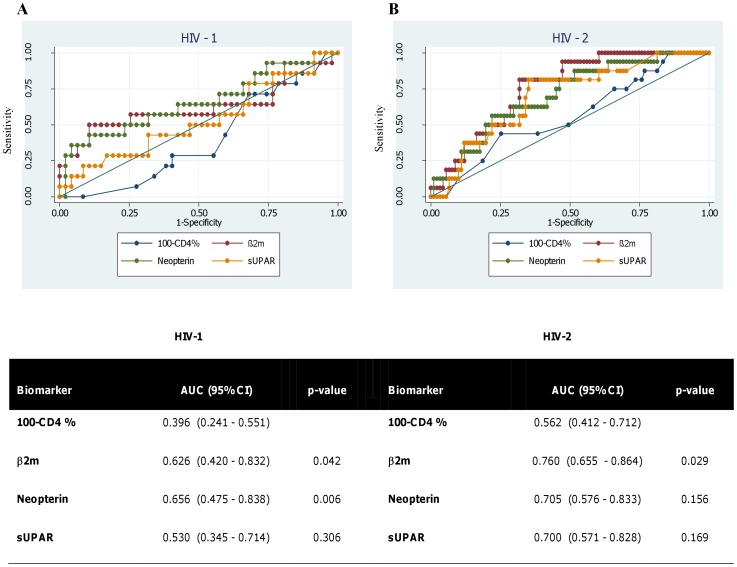
Figure 1. Prediction of death from baseline measurements.
ROC curves for prediction of death within 5 years from baseline measurements of CD4% and the biomarkers for HIV-1 (A) and HIV-2 (B) subjects. Areas under the curves (with 95% confidence intervals) are also shown. P-values indicate significance of the difference in areas compared with the curve for 100-CD4%. Curves approaching the top left hand corner of the graph and an area under the curve (AUC) closer to 1 indicate better predictive ability. An AUC of 0.5 is equivalent to guessing and an AUC of 1 would correspond to perfect prediction of which patients who would die within 5 years and which would not.

