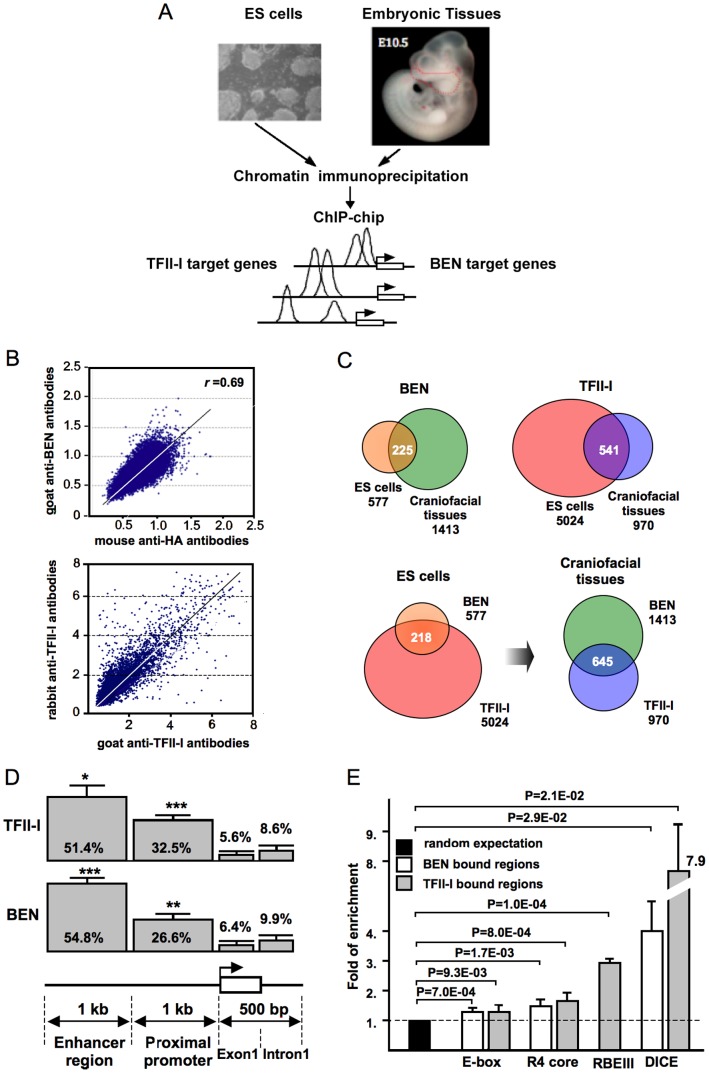
Figure 1. Chromatin isolation and ChIP-chip analysis.
(A) The ChIP-chip strategy. Chromatin was isolated from mouse ESCs and the craniofacial region (CF) of E10.5 mouse embryos. Chromatin immunoprecipitation (ChIP) was performed with TFII-I and BEN-specific antibodies. CF region is marked in red with dashed lines. (B) The correlation between the genome-wide promoter binding using goat anti-BEN and mouse anti-HA antibodies to BEN (left) and rabbit and goat polyclonal antibodies to TFII-I (right). Spearman’s rank correlation coefficient (r) is calculated for each antibody pair. (C) The overall statistics of TFII-I and BEN target genes in ESCs and embryonic craniofacial tissues. (D) Distribution of the TFII-I and BEN-bound genomic sites with respect to the gene structure. The 2 kb region upstream of the transcription start site (TSS) is arbitrarily divided into two 1 kb segments (‘enhancer region’ and ‘proximal promoter’). 0.5 kb region downstream from TSS is split into exon and intron sequences. Bars represent the standard deviation calculated from four (TFII-I) or six (BEN) chip hybridizations, *p<0.1, **p<0.05, ***p<0.01.

