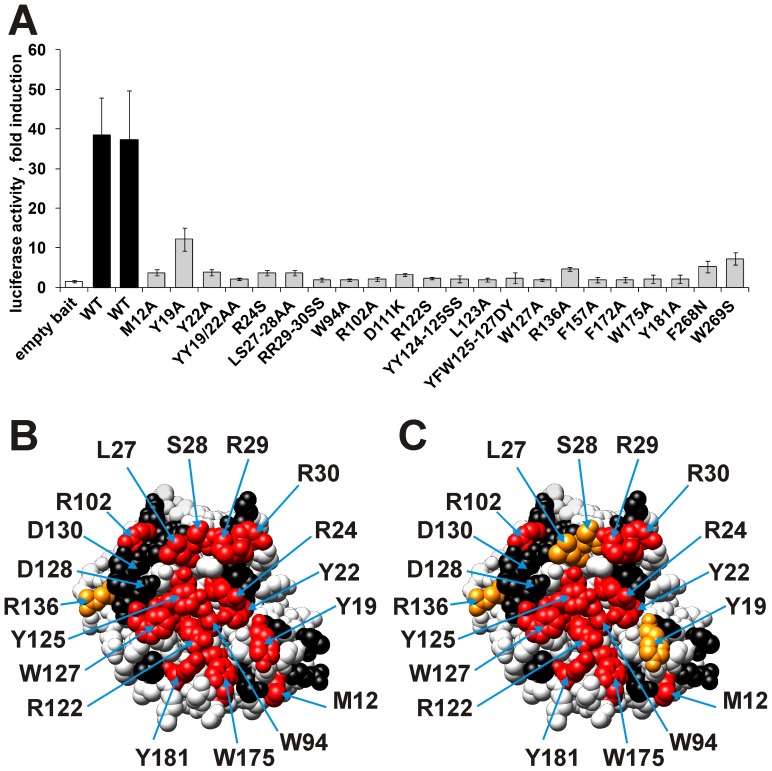
Figure 1. Effect of site-directed mutations in the N-terminal CDA domain of Apobec3G on the interactions with Gagpol and Gag.
A: Effect of mutations on the Apobec3G-Gag interaction. Interactions between the Gag prey and the different mutant Apobec3G baits were determined via MAPPIT. The data are expressed as fold induction of luciferase activity after stimulation with Epo. All mutations that disrupt the Apobec3G-Gagpol interaction (Red/Orange in panel C) also disrupt the Apobec3G-Gag interaction. B &C: The effects on the Apobec3G-Apobec3G (B) and Apobec3G-Gagpol (C) interaction were determined via MAPPIT. The residues of the head-to-head interface are directed towards the viewer. B: Effect of mutations on the Apobec3G-Apobec3G interaction (47). C: Effect of mutations on the Apobec3G-Gagpol interaction. The colors in A and B indicate the relative MAPPIT signal of the Apobec3G bait mutants, compared to wild type. Color codes: Red: <25% of WT, orange: <50% of WT, black: >50% of WT (no strong effect). Mutations that disrupt the Apobec3G-Apobec3G interaction (Red/Orange) also disrupt the Apobec3G-Gagpol interaction.

