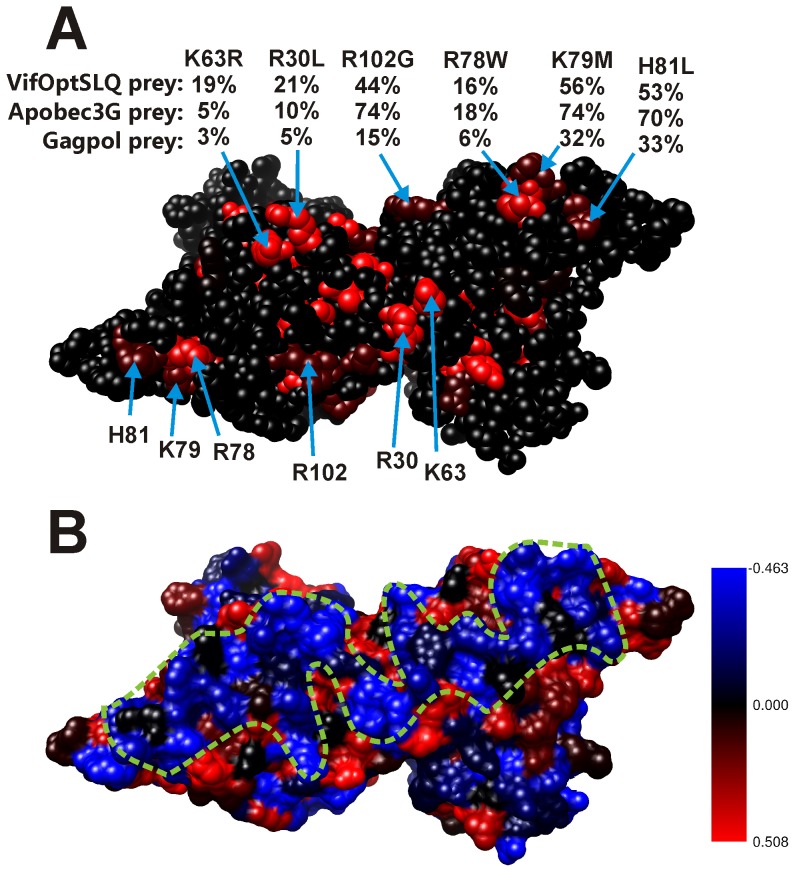
Figure 6. Position and effect of random mutations in the Apobec3G N-terminal CDA domain, modeled as a head-to-head dimer.
A: The effect of mutations on the Apobec3G-Apobec3G interaction is indicated via a color scale from black to red, as in figure 5. Color codes: black: no mutation at this position or 100% of WT (no effect of the mutation), red: 0% of wild type. For each mutation, the relative MAPPIT signals (expressed as % of Wild Type) for interaction with the three preys are shown below the mutation indicator. From top to bottom, the numbers indicate the relative MAPPIT signal for interaction with the Vif prey, Apobec3G prey and the Gagpol prey. Mutations at the surface of the Apobec3G N-terminal CDA domain containing α helices 2, 3 and 4 are shown. In the dimer model, these regions are juxtaposed. B: These mutations coincide with a region with a high RNA binding propensity. The RNA binding propensity is shown by color code: blue: high RNA binding propensity, red: low RNA binding propensity. The putative RNA binding surface is indicated by a dashed green line.

