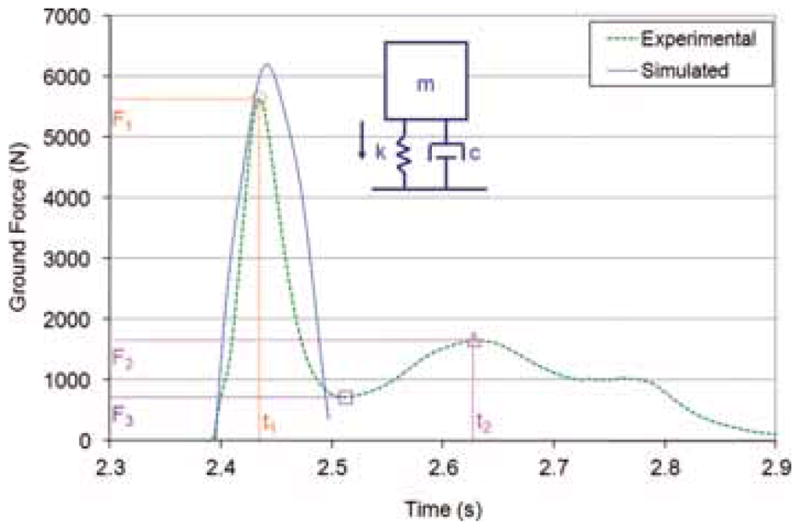
Figure 2.

Sample graph of the experimental ground force versus time for a typical trial (subject 4 falling onto the firm floor, stiffness of 95 kN/m, trial 2) showing key points for buttock stiffness and damping co-efficient calculations (first peak, second peak, and the valley between the first 2 peaks are shown with a circle, triangle, and square, respectively). The inset diagram shows the model used to determine buttock stiffness and damping (m: body mass, k: buttock stiffness coefficient, c: buttock damping coefficient). The simulated ground force for this trial is also shown (only the first peak in ground force was simulated, which was created with the 6-df model shown in Figure 1, not the single df model shown in the inset diagram).
