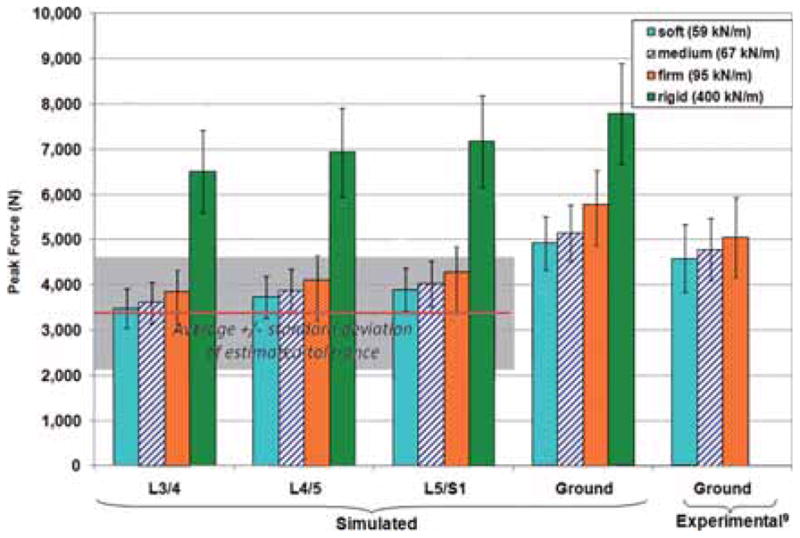
Figure 4.

Average peak simulated ground and spine forces for 10 subjects falling at 3.5 m/s onto floors of 4 different stiffnesses. Standard deviations are shown with error bars. Experimentally measured average peak ground forces are also shown,9 which correspond to impact velocities between 2.5 and 4.1 m/s. The average tolerance (+/− 1 SD, shown with the shaded area) of the lumbosacral spine for a compression velocity of 0.2 m/s is also shown, which was extrapolated between tolerance values for compression velocities between 0.01 and 2.5 m/s.39
