
Figure 10. Anti-inflammatory activity of OSM in macrophages and wound inflammation.
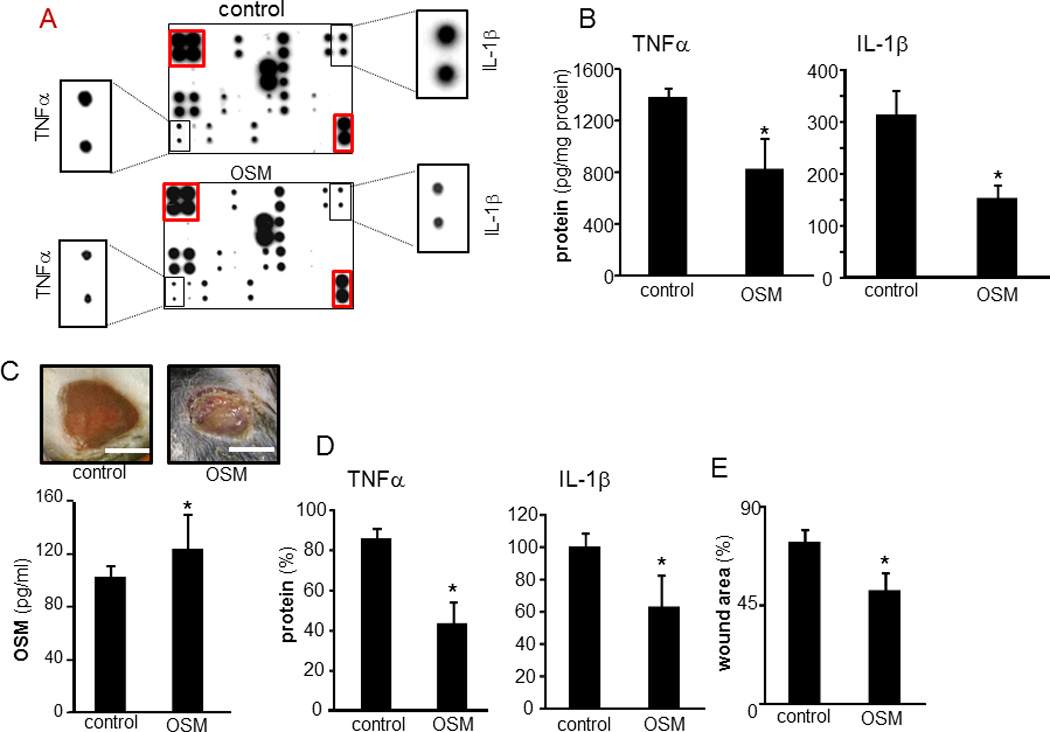
A–B, Human mϕ treated with OSM (25 ng/ml, 72h) followed by treatment with LPS (1 µg/ml, 24h). A, a multiplex cytokine array was performed to evaluate effect of OSM on LPS-induced inflammatory response in human mϕ. The spots marked with red line are housekeeping controls. The zoom of the respective spots for IL-1β and TNFα from each array are shown as insets. B, The levels of LPS-induced TNFα and IL-1β in OSM pretreated mϕ was independently measured using ELISA. Data are mean ± SD (n=3) *, p<0.05 compared to control (con). C–E, Effect of OSM on wound inflammation was evaluated using a murine excisional wound model. C, Representative day 3 post wounding images from excisional wounds treated with recombinant mouse OSM (1.25 µg.15µl−1.wound−1) in early inflammatory phase (0–3d post wounding). Control wounds received vehicle only. OSM levels on day 3 post wounding in wounds tissue treated with recombinant OSM. D, TNFα and IL-1β in OSM pretreated excisional wound on day 3 post wounding. Data are mean ± SD (n=3) *, p<0.05 compared to control. E, wound area in OSM pretreated excisional wound on day 3 post wounding. Wound area is presented as % compared to wound size at day 0 post wounding. Data are mean ± SD (n=3) *, p<0.05 compared to control.