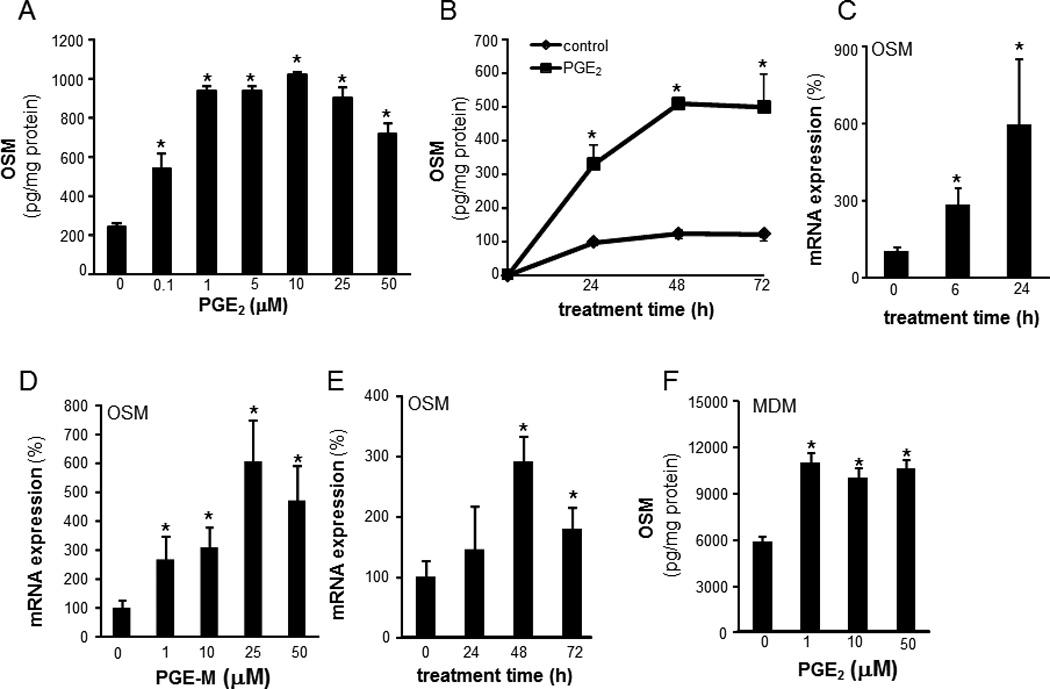
Figure 2. PGE2 and PGE-M induced OSM gene and protein expression in human mϕ.

The human monocytic cell line THP-1 cells were differentiated to mϕ with phorbol-12-myristate-13-acetate (PMA, 20 ng/ml, 48h). A, cells were treated with a range of PGE2 concentrations (0.1 –50µM). OSM level in media was measured after following 72h of treatment. Data are mean ± SD (n=5).*, p<0.05 compared to control. B, cells were treated with PGE2 (10 µm) for 0–72h. OSM protein in media was measured using ELISA. OSM levels were normalized to total cellular protein in the culture. Data are mean ± SD (n=4).*, p<0.05 compared to control. C, cells were treated with PGE2 (10 µm) for 0–24h. OSM gene expression was measured using qPCR. Data are mean ± SD (n=4).*, p<0.05 compared to control. D, cells were treated with varying concentrations (1–50 µM) of PGE-M for 72h. OSM gene expression was measured using qPCR. Data are mean ± SD (n=4).*, p<0.05 compared to 0 µM. E, cells were treated with PGE-M (25 µm) for 0–72h. OSM mRNA expression was measured Data are mean ± SD (n=4).*, p<0.05 compared to 0h. F, MDM were treated with a range of PGE2 concentrations (0.1 –50µM). OSM level in media was measured following 72h of treatment. Data are mean ± SD (n=5).*, p<0.05 compared to control.
