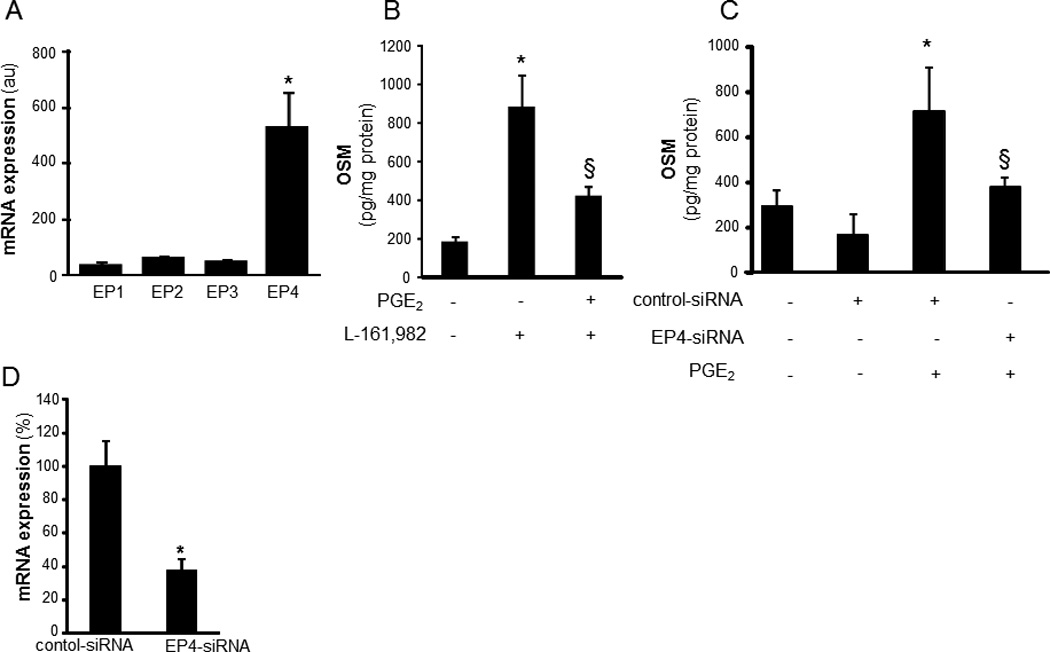
Figure 3. Role of PGE2 receptor expression and function in PGE2-induced OSM expression.

A, relative expression of four PGE2 receptors (EP1-EP4) in differentiated THP-1 mϕ. The mRNA expression of EP receptors was determined using qPCR. Data are mean ±SD (n=4). *, p<0.01 compared to EP1-EP3. B, Cells were pretreated (1h) with L-161,982 (EP4 antagonist, 100 nM) followed by treatment with PGE2 (10 µM, 72h). Level of OSM in culture media was measured using ELISA. Data are mean ± SD (n=6). *, p<0.01 compared to untreated cells; §, p<0.05 compared to PGE2 treated cells. C, cells were subjected to EP4 knockdown (EP4-siRNA) or not (control siRNA, con-siRNA). Following 72h of siRNA transfection, the cells were treated with PGE2 (10 µM, 72h). Level of OSM in culture media was measured using ELISA. Data are mean ± SD *(n=3). p<0.01 compared to PGE2 untreated cells; §, p<0.05 compared to PGE2 treated & con-siRNA treated cells. D, EP4 knockdown was achieved by transfection of cells with EP4 siRNA versus control siRNA. EP4 mRNA levels were determined in cells using qPCR. Data are mean ± SD (n=3). *, p<0.05 compared to control.
