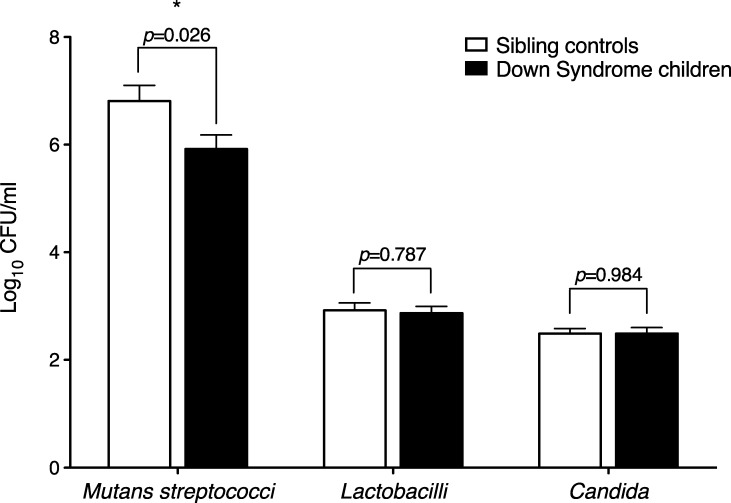
Figure 2.
Mutans streptococci, lactobacilli and Candida salivary levels in Down syndrome children and sibling controls. The bars represent the means, and error bars represent the SD. p-values were calculated using the Student's t-test. *Values are significantly different between DS and sibling controls.

