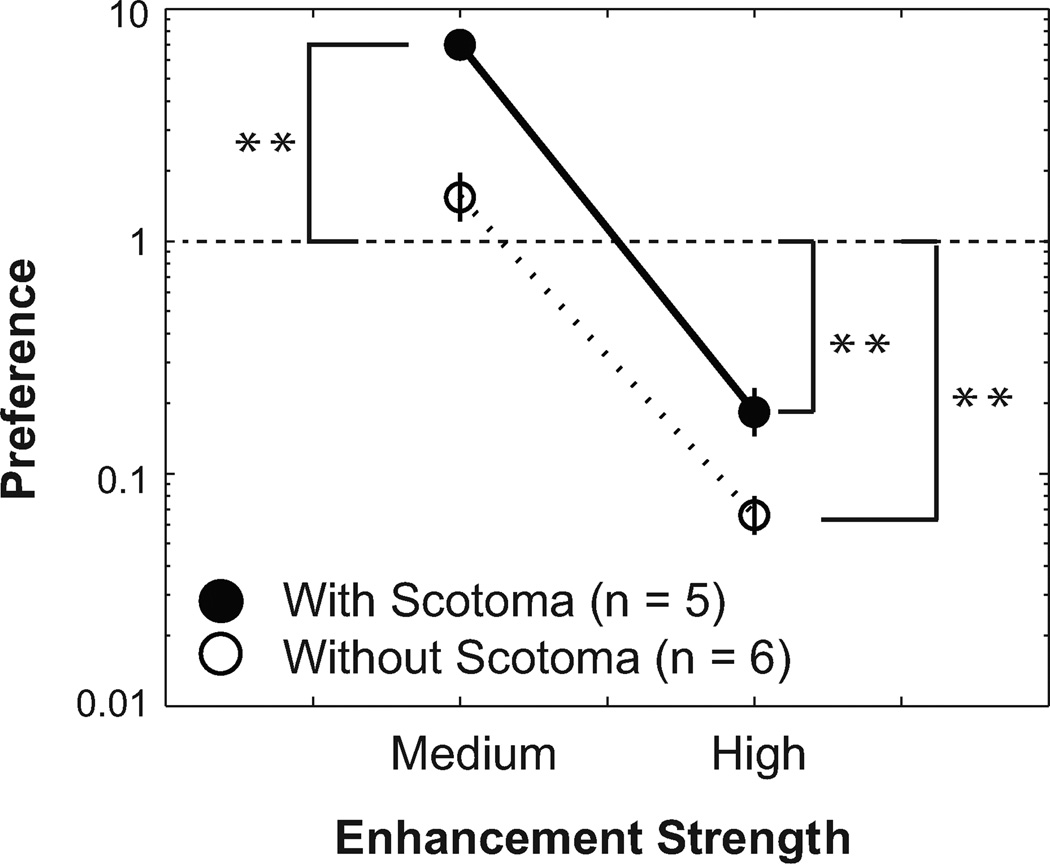
Figure 5.
Preference (penhanced/poriginal) as a function of enhancement strength for older adults. The horizontal dashed line indicates no preference between Original and an enhanced version. Closed circles indicate the average preference values across three content types from the scotoma group and open circles from the scotoma-free group. ** indicates statistical significance at family-wide α = 0.01, after correcting for multiple comparisons.

