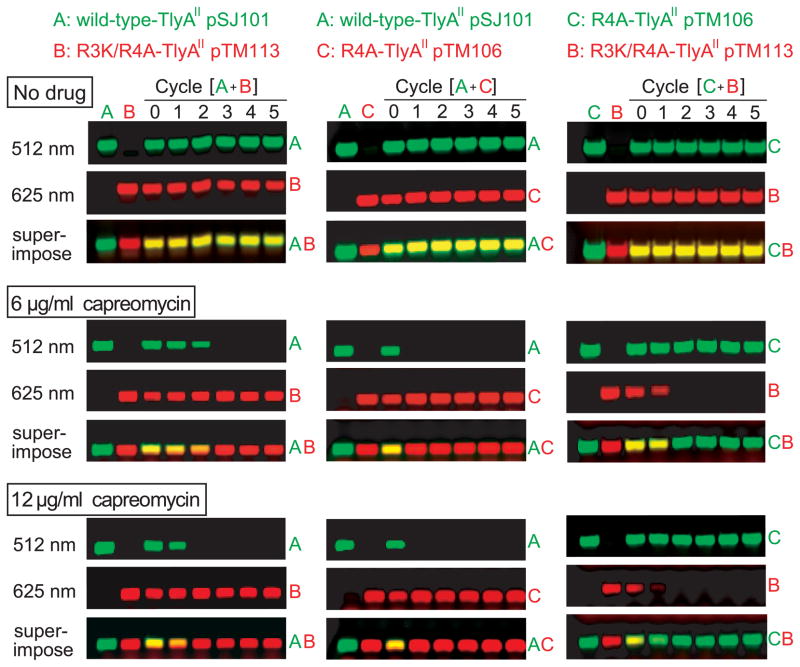
Fig. 5.
Cell growth competition assay. Pairs of E. coli strains with TlyA variants, differing in the degree of 2′-O-methylation at C1409 and C1920, were grown together through five cycles (with approximately eleven generations per cycle) in the presence of sub-inhibitory concentrations of capreomycin. The proportion of each strain was determined by PCR with fluorescently-labelled primers. Left column: wild-type strain expressing TlyAII from plasmid pSJ101 (A) grown in competition with the R3K/R4A-TlyAII strain (B, pTM113); the upstream PCR primers complementary to these tlyA sequences were respectively labelled with Cy3 (fluorescing green after excitation at 512 nm) and Cy5 (fluorescing red after excitation at 625 nm). Centre column: wild-type TlyAII strain grown in competition with the R4A-TlyAII strain (C, pTM106) and analyzed with Cy3 and Cy5 primers, respectively. Right column: R4A- and R3K/R4A-TlyAII strains grown in competition (note Cy3 is used here for the R4A strain). Upper row, no drugs; middle row, competition in 6 μg capreomycin ml−1; lower row, competition in 12 μg capreomycin ml−1. The superimpositions of the 170 bp PCR products appear yellow when the amounts of strains are approximately equal, and the red or green colour becomes predominant when one strain out-competes the other. Each data set is representative of a minimum of three growth assays.

