Fig. 1.
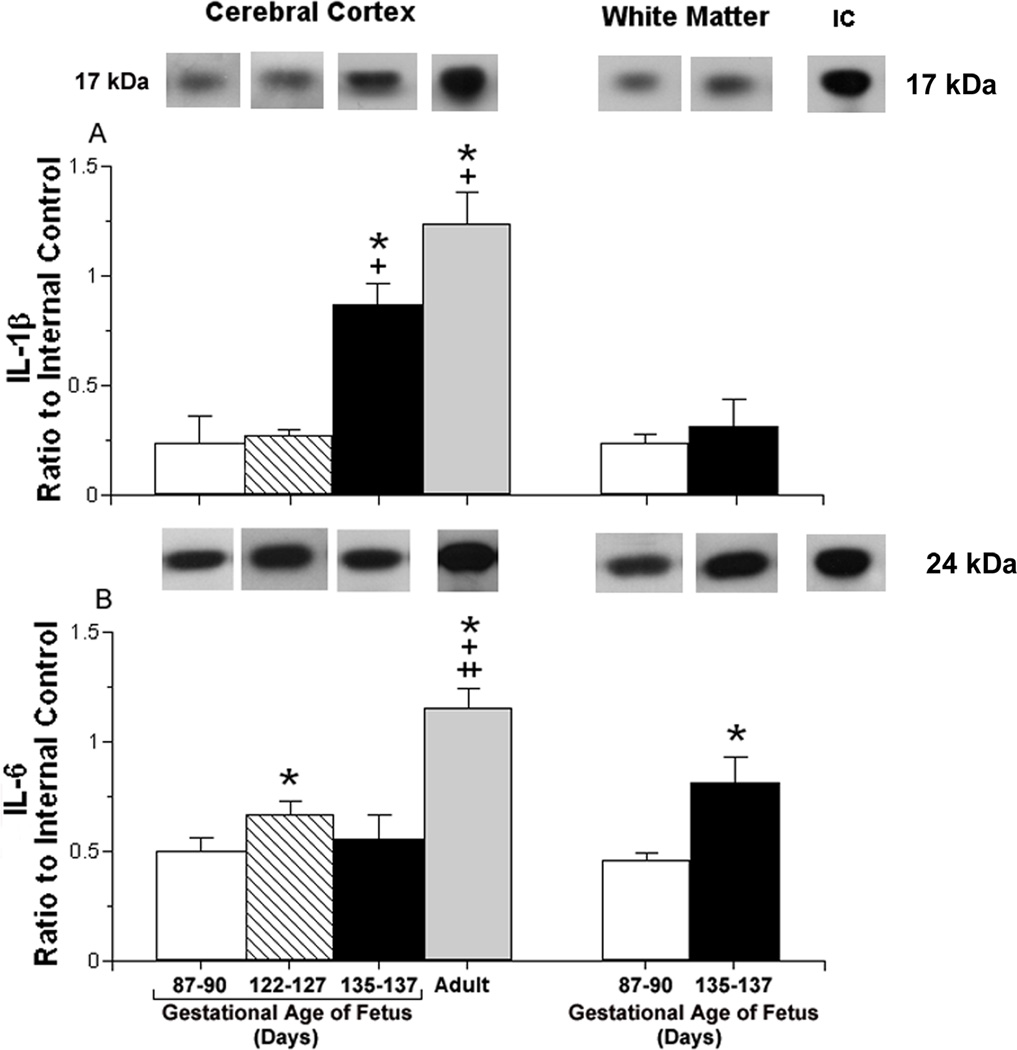
Constitutive interleukin protein expression plotted as a ratio to the internal control protein (IC) in the cerebral cortex and white matter of ovine fetuses.
Panel A shows: Representative Western immunoblots of IL-1β protein expression are shown for each study age group. The extracts from the brain tissues of the different age groups were placed on different immunoblots. Therefore, for the purpose of illustration in this and the subsequent figures, the most representative immunoblot for the mean value of each bar graph was presented for each age group.
IL-1β protein expression in the cerebral cortex of ovine fetuses at 87–90 (open bar, n=6), 122–127 (hatched bar, n=6), 135–137 (closed bar, n=6) days of gestation and in non-pregnant adult sheep (gray bar, n=3); [ANOVA, main effect for age group, F (3, 17) =72.8, P<0.001] and in white matter of ovine fetuses at 60 (open bar, n=6) and 135–137 (closed bar, n=6) days of gestation [ANOVA, main effect for age group, F (1,10) = 4.71, P<0.06]. IC is the internal control value.
Values are m±SD. *P<0.05 versus fetus at 87–90 days of gestation, +P<0.05 versus fetus at 122–127 days of gestation, ++P<0.05 versus fetus at 135–137 days of gestation.
Panel B shows: Representative Western immunoblots of IL-6 protein expression are shown for each study age group. IL-6 protein expression in the cerebral cortex of ovine fetuses at 87–90 (n=6), 122–127 (n=6), 135–137 (n=6) days of gestation and in non-pregnant adult sheep (n=3); [ANOVA, main effect for age group, F (3,17) = 11.9, P<0.0001] and for white matter of ovine fetuses at 87–90 (n=6) and 135–137 (n=6) days of gestation [ANOVA, main effect for age group, F(1,10) =35.8, P<0.001]. Symbol and statistical legends as for A.

