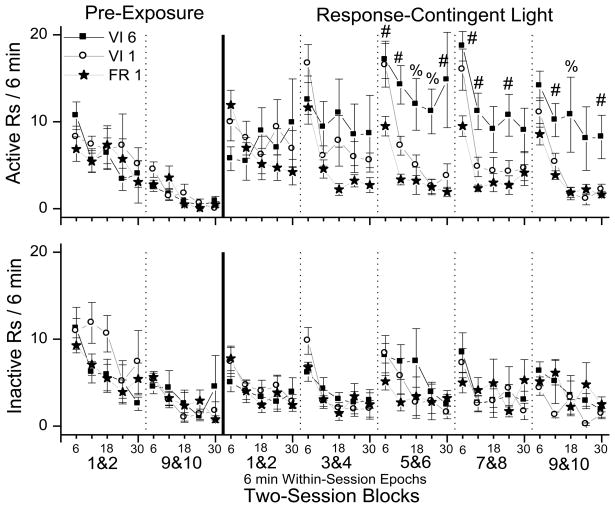
Fig. 2.
These plots show the within-session patterns of responding for response-contingent light. Active responding is plotted in the top row and inactive responding is plotted in the bottom row. Each plot shows the data for three schedules of response-contingent light onset: squares indicate variable-interval 6 min (VI 6), circles indicate variable-interval 1 min (VI 1), and stars indicate fixed ratio 1 (FR 1). The first two columns on the left side of the solid vertical lines show the first and last two-session blocks of the pre-exposure phase. The five columns to the right of the solid line show all five two-session blocks of the testing phase. The individual two-session blocks are indicated by vertical dashed lines. Active and inactive responding are plotted in five six-minute epochs within the 30 min test sessions. Pound signs designate significant Tukey HSD tests (p < 0.05), indicating that the VI 6 group had greater responding than the FR 1 group. The percent signs indicate that the VI 6 group had greater responding than both the FR 1 and VI 1 groups. Data are expressed as means with error bars indicating standard error of the mean.

