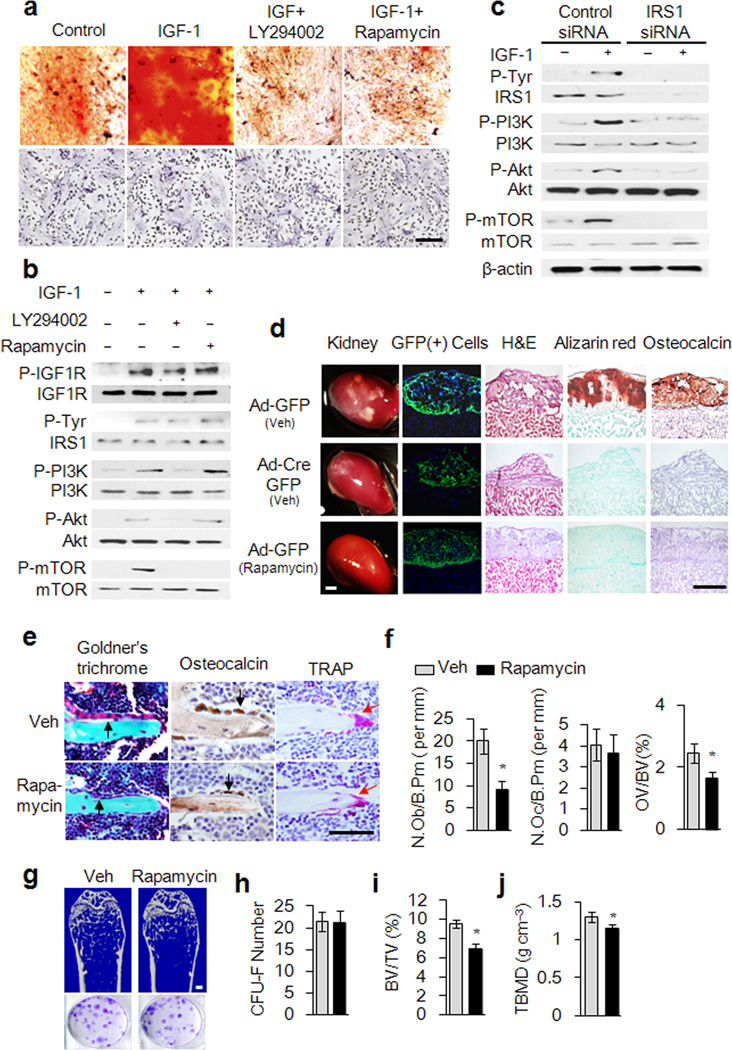
Figure 3. IGF-1 induces osteoblastic differentiation of MSCs through the IRS-PI3K-Akt-mTOR pathway.
(a) Alizarin red staining showing Osteoblastic differentiation of Sca-1+ MSCs induced by IGF-1 as indicated (top panels). Alive cells number was determined by hematoxylin staining (bottom panels). Scale bar: 100 µm. (b) Western blot analysis of IGF-1 induced phosphorylation of IGF1R, IRS1, PI3K, Akt, and mTOR in Sca-1+ MSCs treated with IGF-1 (20 ng ml−1) or vehicle in the presence or absence of LY294002 (10 µM) or rapamycin (20 nM) for 15 minutes as indicated. (c) Western blot analysis of IGF-1-induced phosphorylation of IRS1, PI3K, Akt, and mTOR in Sca-1+ MSCs treated by IGF-1 after transfected with Irs1 siRNA or control siRNA. (d) IGF-1 induced Sca-1+ MSCs differentiation underneath renal capsules. The renal sections were analyzed by direct GFP fluorescence visualization, H&E staining, Alizarin red staining or immunohistology for osteocalcin. Scale bar: 100 µm. (e–g) Rapamycin impairs trabecular bone formation. Representative images of mouse distal femora sections with staining of Golder’s Trichrome, osteocalcin or TRAP (e). Scale bar: 100 µm. Histomorphometric analysis of remodeling trabecular bone after treated with rapamycin: number of osteoblast per bone perimeter (f left), number of osteoclast per bone perimeter (f center), Osteoid volume/bone volume (f right), μCT Representative images of distal femora (g top), Scale bar: 1 mm. CFU-F assays (g,h), trabecular bone volume fraction (TBV/TV) (i) trabecular bone mineral density (TBMD) (j). Data represent the mean ± SEM. n = 5. *p < 0.05.

