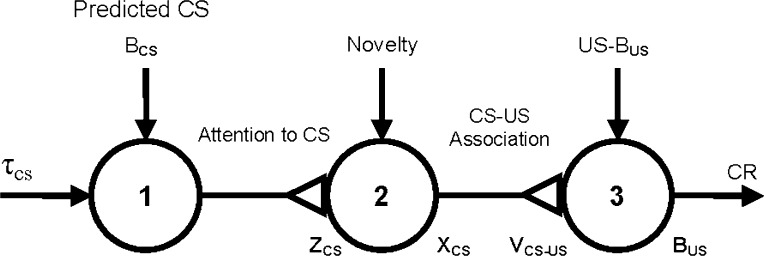
Fig. 5.
A simplified diagram of the attentional-associative model (from Larrauri and Schmajuk 2008). Triangles represent variable connections between nodes. Arrows represent fixed connections between nodes. τcs—trace of the CS; zcs—attention to the CS; Xcs—internal representation of the CS; Vcs–us—CS–US association; Bcs—predicted CS; Bus—predicted US; CR—conditioned response

