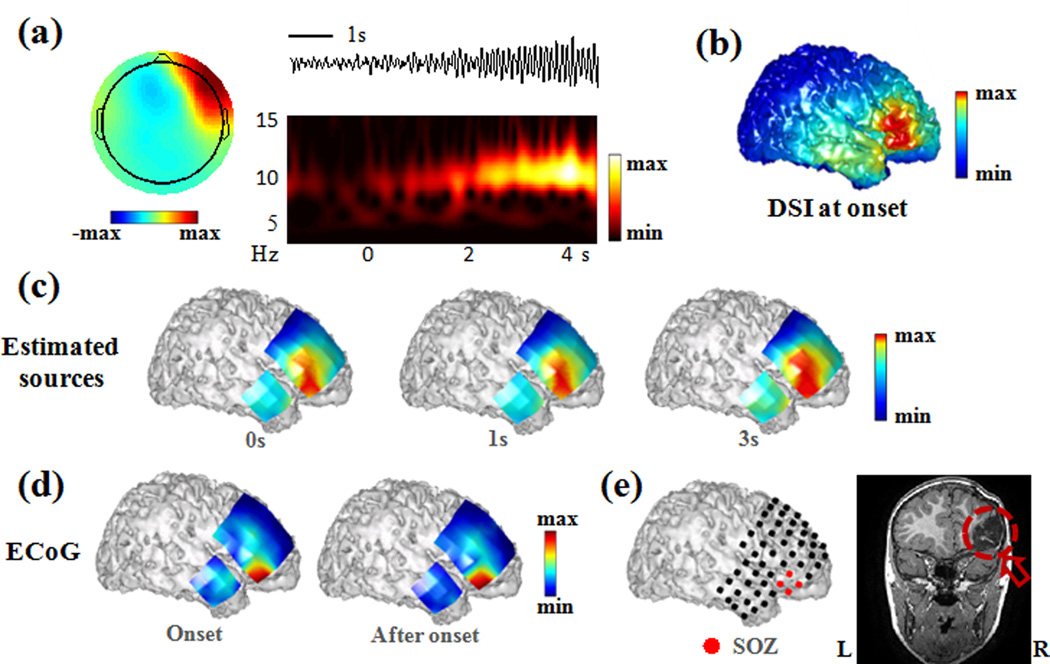
Fig. 2.
Seizure source imaging results in Patient 1. (a) Example of scalp topography, activity, and time-frequency representation of a seizure component. (b) Estimated source at seizure onset. (c) Estimated seizure sources following seizure onset. The estimated sources were displayed by projecting them onto the cortical grid surface. (d) Power distribution of recorded ECoG activity following seizure onset. (e) Seizure onset zone (red color) marked on ECoG grid and surgical resection circled on post-operative MRI image of the patient.

