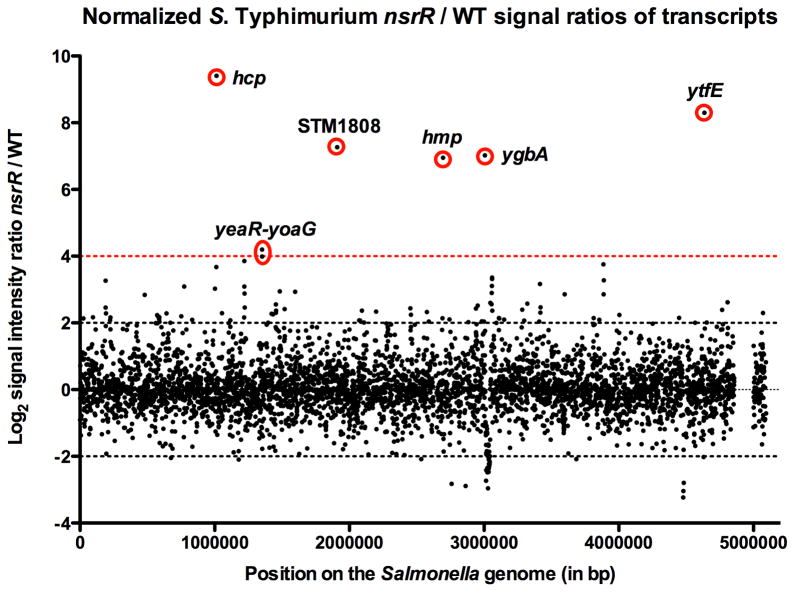
Figure 2. Normalized S. Typhimurium nsrR/WT signal ratios of mRNA from microarray analysis of S. Typhimurium 14028s.
The x-axis represents position on the Salmonella genome in base pairs (bp) (pSLT genes at bp 5,000,000), and the y-axis represents the Log2 signal intensity ratio nsrR/wild-type (WT) mRNA from microarray data (Supplemental Table 1). Log2 signal intensity ratio nsrR/wild-type -2 and 2 of nsrR/WT mRNA transcripts are indicated with dotted black lines, whereas the log2 signal intensity ratio of 4 is indicated by a dotted red line. Genes negatively regulated by NsrR are indicated with red circles.

